
You’re making decisions every day that shape revenue, growth, and risk. But when data is scattered or delayed, you’re forced to rely on instinct. Business intelligence (BI) for decision making brings clarity to your numbers, reveals what’s really happening across the business, and helps you act early instead of reacting when problems become costly.
This article breaks down the hows and whys by delving into what business intelligence for decision making is, how it supports better decisions, and how it works in practice. It also explores why some BI initiatives deliver real results while others fall flat and shows you how to measure whether BI is truly creating impact for your business.
What Is Business Intelligence in Decision-Making?
Business intelligence decision-making is about turning scattered business data into clear, timely insights you can act on. In simple terms, business intelligence combines tools, processes, and analytics to pull data from across your organization: sales, marketing, CRMs, engineering, etc; analyze it and present it in a way that supports better decisions.
Instead of debating whose spreadsheet is correct, BI creates a single, trusted view of performance, which is usually in the form of a dashboard. It helps you understand what’s happening now, why it’s happening, and where things are heading next. The result is faster, more accurate decisions that stay aligned with business goals.
How Business Intelligence Decision-Making Works
Effective BI follows a decision-first flow, not a reporting-first one. This means that it doesn’t just tell you what happened but helps you make decisions for the future; to prevent problems from turning into emergencies, to cut costs, and increase efficiency, productivity, and revenue.
The four steps to a decision-first flow are:
1. Data collection: BI tools pull data from core systems such as sales, marketing, finance, product, and operations.
2. Data preparation: This data is cleaned, standardized, and unified so every team works from the same numbers and definitions.
3. Analysis and visualization: Insights are surfaced through dashboards, charts, and alerts that highlight what truly matters, not everything that exists.
4. Action: Leaders use these insights to make proactive, data-driven decisions before small issues escalate. In advanced BI setups, recommended next steps and forecasts are built directly into workflows.
If you are a CFO, CMO, or business leader using business intelligence the right way, you will be able to answer these 4 questions.
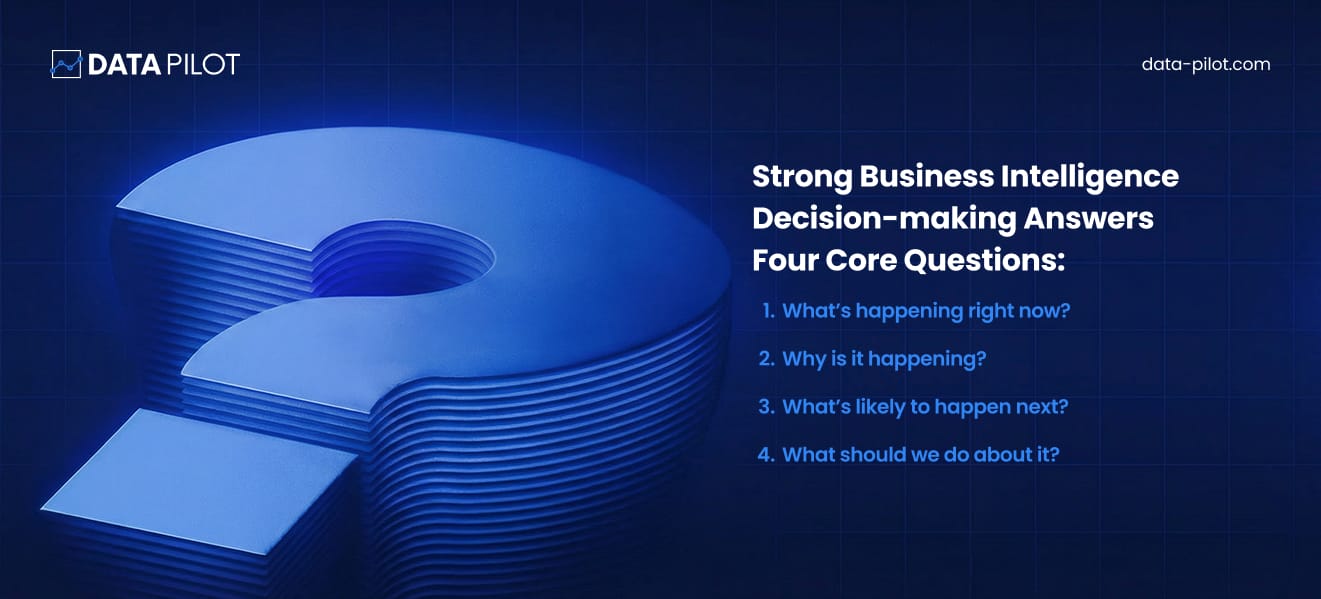
These questions outline descriptive, predictive, and prescriptive analytics.
Descriptive, Predictive, and Prescriptive Analytics Explained
Business intelligence decision making typically operates across three analytical layers: descriptive, predictive, and prescriptive analytics. Each layer answers a different leadership question and together they form a complete decision system.
Descriptive analytics answers: What happened?
This is the foundation of BI. Descriptive analytics aggregates historical data to explain past performance using KPIs, dashboards, and standardized reports. Revenue trends, churn rates, campaign performance, operational efficiency, and financial variance analysis all fall into this category.
For example, aretail chain uses descriptive analytics to review last quarter’s sales, customer traffic, and top-selling products. Dashboards highlight which stores hit targets and which lagged.
For CXOs, this answers “what happened” and provides a single source of truth before planning the next move. It ensures everyone is aligned on the same numbers before any strategic discussion begins. However, on its own, descriptive analytics is backward-looking and insufficient for proactive decision-making.
Predictive analytics answers: What is likely to happen next?
Predictive analytics uses statistical models, machine learning, and historical patterns to forecast future outcomes. This includes demand forecasting, customer churn prediction, revenue projections, and risk scoring.
Going back to the example for descriptive analytics, now the retail chain wants to prepare for the next quarter. Using predictive analytics, they analyze historical sales, seasonal trends, and customer behavior to forecast demand. The system predicts which stores will see higher traffic, which products are likely to sell out, and which regions may underperform.
With these insights, leaders can proactively adjust inventory, plan staffing, and launch targeted promotions,making decisions based on likely outcomes rather than reacting afterwards.
As highlighted, at the executive level, predictive analytics shifts decision-making from reactive to anticipatory. Instead of responding to missed targets or customer loss after the fact, leaders can see leading indicators early and intervene while there is still time to influence outcomes.
Prescriptive analytics answers: What should we do about it?
Prescriptive analytics is the most advanced layer. It combines predictive models with business rules, constraints, and optimization techniques to recommend specific actions. Examples include recommending optimal pricing strategies, suggesting which customer segments to prioritize, identifying the best allocation of budget or inventory, or triggering automated responses when thresholds are crossed.
Building on the forecasts from predictive analytics, the retail chain uses prescriptive analytics to decide exactly what actions to take. The system recommends how much inventory to send to each store, which products to discount, and where to focus marketing campaigns. Instead of guessing, leaders can follow data-driven guidance to maximize revenue, reduce overstock, and ensure high-demand products are always available.
For CXOs, prescriptive analytics directly supports execution. It reduces decision friction by translating insights into clear, actionable guidance rather than leaving interpretation to individual teams.
The takeaway for CXOs
Many organizations stop at descriptive reporting and believe they are data-driven. High-performing organizations move up the analytics maturity curve. They use descriptive analytics for alignment, predictive analytics for foresight, and prescriptive analytics for decisive action. When business intelligence integrates all three layers, it becomes a true decision engine.
Why BI Tools Matter: Supporting Strategic Decisions
Let’s imagine a particular scenario.
Your marketing team spots a small but steady decline in engagement from a key customer segment. On its own, it doesn’t seem urgent. Without context, you might shrug, keep running campaigns as usual, and hope it fixes itself. Meanwhile, a competitor notices the same trend in their own BI dashboards and acts immediately, launching a targeted campaign, adjusting their product messaging, and reaching out to those customers before they even consider leaving. By the time you react, your customers are already gone.
This is the difference BI makes.
It’s not about dashboards full of numbers or flashy charts. It’s about creating a system that connects the dots across your organization and surfaces insights before small problems become big losses. The story of a missed opportunity or a delayed decision is all too common in companies that treat BI as a reporting tool rather than a decision engine. When BI is done right, it embeds itself into your daily decision-making. It tells your team what is likely to happen next, where risks are emerging, and which actions will create the most impact.
Business intelligence becomes more than software. It turns data into foresight, foresight into action, and action into growth. And in today’s competitive landscape, that edge is what separates the leaders from the laggards. Business intelligence tools are like a pair of high-powered glasses for your company data. They help you see patterns, trends, and insights that are impossible to spot just by looking at spreadsheets.
At the leadership level, decisions often involve trade-offs: growth versus profit, speed versus risk, investment versus efficiency. But how do you as a leader decide what to prioritize and what not to?
BI brings evidence into these conversations. It helps by:
- Showing long-term customer, revenue, and market trends: Instead of reacting to short-term fluctuations, leaders can see patterns over months or years. This makes it easier to plan growth strategies, allocate resources, and spot emerging opportunities before competitors do.
- Testing “what if” scenarios before committing resources: BI tools allow you to model different outcomes. For example, what happens if marketing spend increases by 20% or if a new product launches in a certain region. This reduces risk and helps teams make more evidence-based decisions.
- Tracking whether strategies are delivering results. With dashboards and real-time reports, you can see which initiatives are working, which need adjustments, and which should be paused.
Let’s explore another example.
A retail chain uses business intelligence to analyze sales, promotions, and inventory across all its stores. BI revealed that certain products sold much faster in urban areas during holidays. What did the retail chain do?
They adjusted stock and promotions in those areas based on these insights. As a result, the chain increased holiday revenue and reduced overstock waste.
When BI is working well, strategy meetings rely less on opinions and more on shared facts. That
- Reduces bias
- Improves decision quality
- Ensures the whole organization is aligned around what works.
Harvard Business Review states in a report that the first question a data-driven organization asks itself is not ‘What do we think?’ but ‘What do we know?’
Also Read: Unveiling the Power of Data Analytics with Compelling Storytelling
Advantages of Business Intelligence for Decision-Making
Here are the key benefits of using business intelligence for decision-making.
Faster, Smarter Daily Decisions
Not all decisions are big picture. Many happen every day across sales, operations, and customer support. Business intelligence improves operational decision making by:
- Providing real-time or near-real-time performance visibility
- Flagging issues early, before they turn into major problems
- Giving teams access to self-service insights
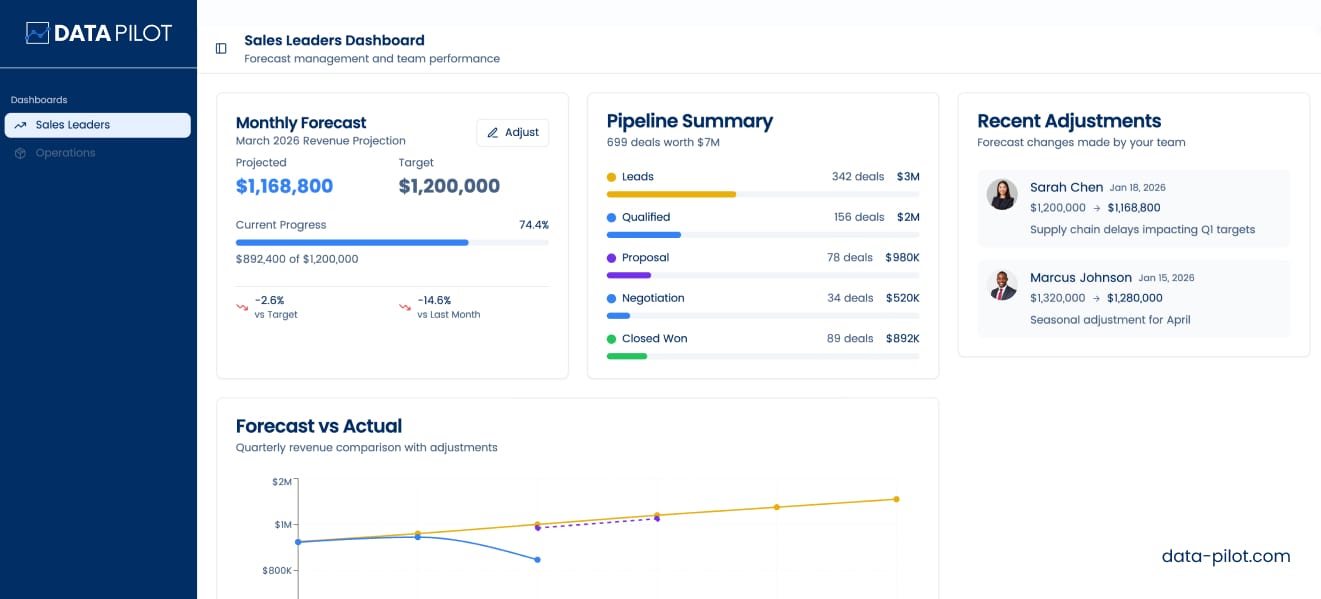
For example, sales leaders can adjust forecasts using live pipeline data, operations teams can spot bottlenecks early, and support managers can act on rising ticket volumes before SLAs are missed. The result is faster decisions with fewer surprises.
Here is an example of a BI dashboard for sales leaders with forecasting data, pipeline summary, forecasted versus actual performance, and individual sales representative performance.
Here is another example of a dashboard for an operations leader highlighting process health, bottlenecks, and trends.
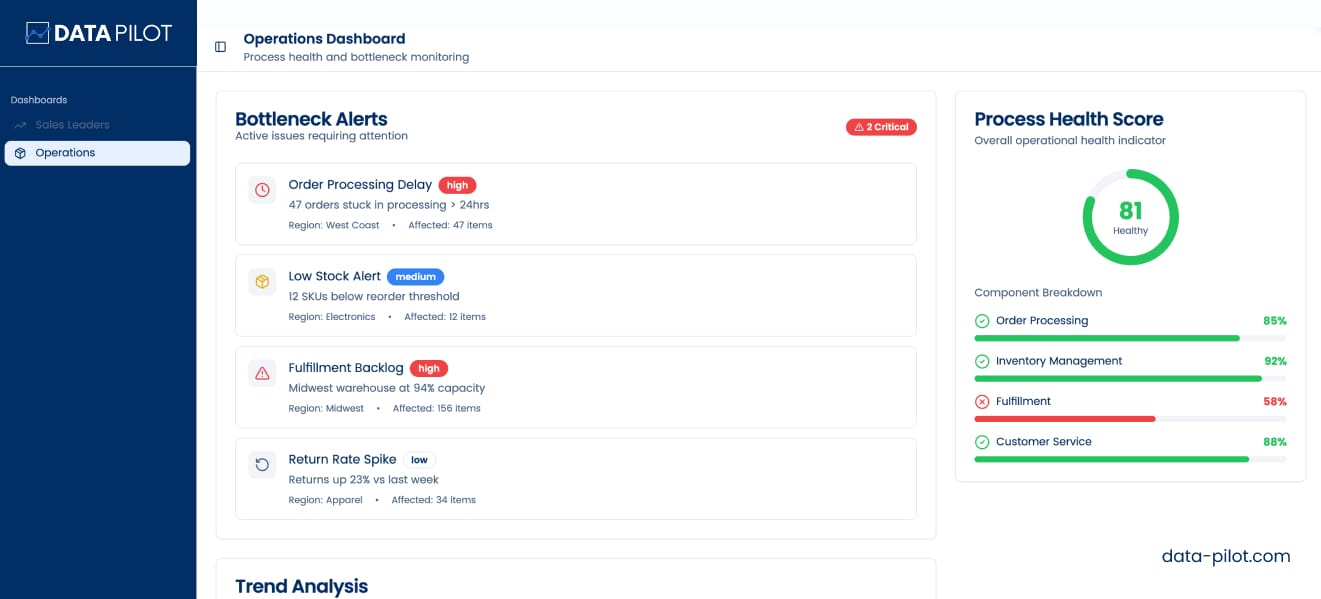
With this information, leaders can easily spot where problems exist, make decisions within seconds, and solve the problem before it even becomes a nuisance or hindrance.
Better Data Reduces Risk
Every decision carries risk. Decisions made without data carry much more. BI reduces risk by:
- Identifying early warning signs in financial and operational data
- Turning gut feelings into measurable risk indicators
- Supporting compliance with clear, auditable reporting
In regulated industries especially, BI helps leaders explain and justify decisions with data and this is something that’s increasingly expected. Beyond that, BI enables scenario planning, letting leaders model different business outcomes before committing resources. It also improves resource allocation, ensuring teams invest time, money, and personnel where they’ll have the most impact. By uncovering hidden patterns and correlations, BI can reveal risks that aren’t obvious, helping organizations stay ahead of competitors.
In fast-moving industries, this predictive capability gives companies a significant strategic advantage.
Keeping Teams Aligned Around the Same Numbers
One of the most overlooked benefits of business intelligence decision making is alignment. When teams rely on different reports, decisions become disconnected. BI solves this by:
- Standardizing KPIs across departments
- Making insights accessible to both technical and non-technical users
- Giving everyone visibility into goals and progress
This shared view reduces friction, speeds execution, and prevents teams from pulling in different directions. However, sometimes, BI may fail to do its job effectively. Let’s look at how that happens.
Why BI Often Fails to Improve Decisions and How to Fix it
Many companies invest heavily in BI but see little impact. The reason is simple: insight without action doesn’t create value. Dashboards that sit unused, reports that confuse rather than clarify, or metrics that don’t align with strategic goals all lead to wasted time and missed opportunities. To fix this, BI must be designed around decisions, not just data.
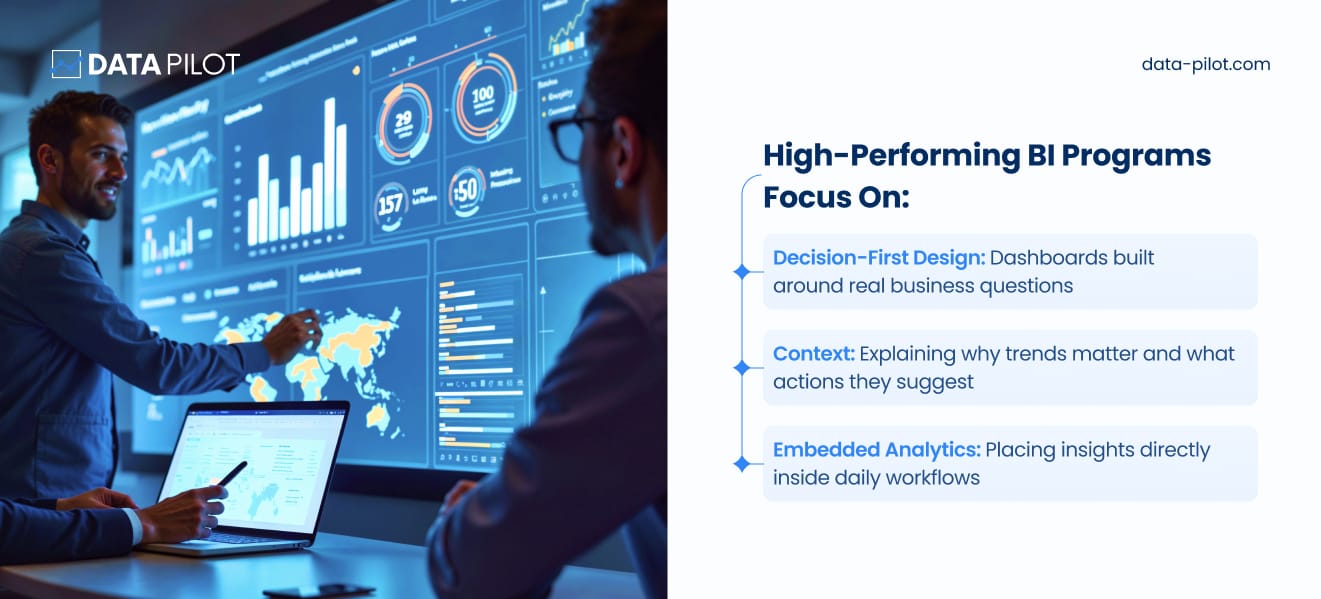
To build a high-performing BI program it is important to focus on the following:
- User-Friendly Tools – Dashboards and reports are designed so anyone, from executives to front-line employees, can understand and use them without needing a data science degree.
- Standardized Metrics – Everyone in the organization measures success the same way, which reduces confusion and debates about whose numbers are “right.”
- Proactive Decision Support – Instead of just reporting what happened, BI programs help leaders anticipate problems, test “what if” scenarios, and plan strategically.
- Embedding AI Into Workflows – Leveraging AI to automate analysis, generate predictive insights, and suggest actions directly in employees’ day-to-day workflows.
- Culture and Training – They focus on making data-driven decision-making part of the company culture, with training so employees know how to interpret and act on insights.
- Continuous Improvement – BI isn’t set-it-and-forget-it. High-quality programs regularly review performance, refine metrics, and adjust dashboards to stay aligned with business goals.
The Role of AI, Advanced Analytics, and AI Agents
As mentioned above, modern BI goes beyond looking at the past. However, besides enabling making decisions, BI also helps automate action through AI agents. AI agents collect, analyze, and act on data automatically. With AI and advanced analytics, BI can now automate low-risk decisions so teams can focus on complex ones.
For example, a global e-commerce company uses AI-powered BI to forecast demand for different products across regions. The system predicts which items will sell out and automatically adjusts inventory and pricing strategies. This reduces stockouts, increases sales, and frees the operations team to focus on high-impact campaigns instead of routine restocking decisions. This turns BI into an active decision partner, especially valuable in fast-moving, data-heavy businesses.
Gartner predicts that by 2027, 50% of business decisions will be augmented or automated by AI agents as part of data and analytics strategies.
How to Measure BI’s Impact on Decision Making
To know whether BI is working, usage isn’t enough. What matters is outcomes. So, how do you measure value?
Strong signs BI is delivering value include:
- Faster decision cycles
- More accurate forecasts
- Higher ROI on initiatives
- Fewer decisions reversed due to bad data
If these improve, BI is doing its job effectively.
Business Intelligence as a Competitive Advantage
In today’s market, speed and accuracy matter. Business intelligence decision-making helps organizations cut through complexity, reduce risk, align teams, and act with confidence. The companies that win are the ones that use BI to make better decisions; faster and at scale. When BI is designed around decisions instead of dashboards, it becomes one of the most powerful tools a business can use.