Every business decision, from what to sell to how to better serve customers, is based on data. However, inaccurate data can be a silent killer. It results in expensive errors, resource waste, and disgruntled clients. So how do you determine the quality of your data? How does one go about measuring the quality of data?
In order to ensure that your decisions are not based solely on intuition, data quality dimensions and metrics quantify how accurate, comprehensive, and trustworthy your data is. Consider it similar to cooking: if the ingredients are stale, even the best recipe will not work. Similarly, your data must be current, accurate, and pertinent. This post will explain the main methods used by companies to assess data quality and why accuracy is crucial.
What is a measure of the quality of data?
Dimensions and metrics are two factors to take into account when evaluating the quality of data. What are those?
1. Dimensions are the different aspects or areas of data quality you care about, like accuracy, completeness, or consistency.
2. Metrics are measurable values: numbers that help track how well your data is performing based on these dimensions, like error rate, duplicate count, etc.
If any of these outcomes are off, the results of your work, whether it’s a marketing campaign, a financial forecast, or customer support, can be negatively impacted. Metrics are numbers that show you exactly how well your data is performing and where it stands in terms of quality. These metrics are obtained when you measure these dimensions or elements. We’ll go into more detail about this later in the blog.
Having high-quality data can mean the difference between staying ahead of the competition and falling behind. For instance, a retail business can increase sales and send promotions on time if it has the most recent customer addresses. However, a business that has duplicate or out-of-date customer records runs the risk of squandering funds on offers that never get through to the target market.
Actually, research indicates that businesses lose millions of dollars annually as a result of inadequate data. According to estimates, poor data quality causes businesses to lose 15–25% of their revenue on average. This estimate, which was derived from industry research, is frequently brought up in discussions about data strategy and analytics, including reports that highlight the negative effects of bad data on business.

That’s not just numbers on a spreadsheet, that’s resources, opportunities, and trust being lost.
How do you measure the quality of data?
So, how do businesses really determine whether their data is good or bad? As previously stated, data quality dimensions serve as the foundation for assessing the quality of data and are quantified using metrics.

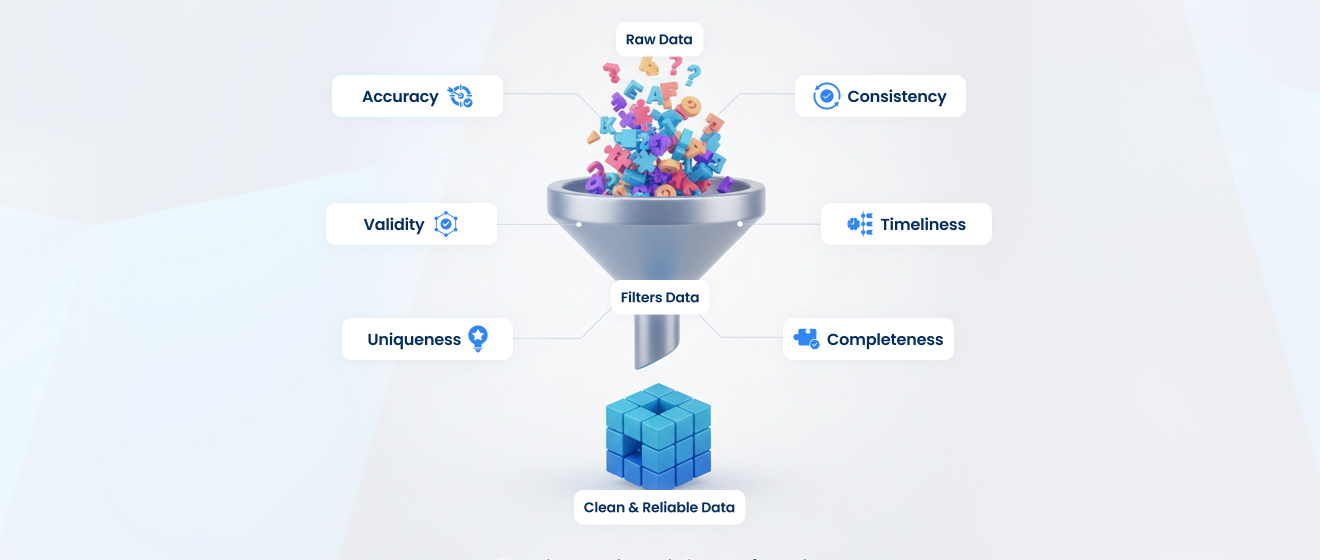
Data quality dimensions include accuracy, completeness, consistency, timeliness, uniqueness, and validity:
- Accuracy measures whether the data reflects reality. If a customer’s phone number is recorded incorrectly, that’s inaccurate data.
- Completeness checks if all the information that should be there actually is. A retail company that has only half the email addresses of its customers would struggle to run marketing campaigns effectively.
- Consistency ensures that data is the same across multiple systems. If a customer’s address is “123 Main St.” in the CRM, it isn’t “123 Main Street” in billing records. Even small inconsistencies like this can create big problems in reporting or operations.
- Timeliness, focuses on whether data is up-to-date. For example, a stock trading platform needs real-time data. If the information is old, traders make decisions based on outdated facts, which can cost the company and its customers a lot.
- The goal of uniqueness is to ensure that the system is free of duplicates. A customer may receive repeated emails or offers if they have multiple entries, which can be inconvenient and frustrating.
- Validity guarantees that data adheres to the necessary guidelines or format. For example, a date entered as February 31, 2026, is not valid and would result in errors in any automated system that uses it.
Here are the dimensions of high-quality data, how to measure them, and why they matter summarized:
| Dimensions | What It Measures | How to Measure | Why It Matters |
| Accuracy | Is the data correct? | Compare entries against trusted sources or validation rules | Incorrect data leads to bad decisions and wasted resources |
| Completeness | Are all required fields filled? | Check for missing or null values in critical fields | Missing info can halt processes or cause errors |
| Consistency | Does data match across systems? | Run cross-system comparisons or automated sync checks | Inconsistent data confuses reporting and workflows |
| Timeliness | Is the data up-to-date? | Measure the age of records and update frequency | Outdated data can cause inventory or service mistakes |
| Uniqueness | Are there duplicate records? | Use deduplication tools or queries to find repeats | Duplicate entries inflate numbers and distort analysis |
Measuring each of these dimensions yields a metric that indicates the quality of your data. The following metrics are used to assess the quality of data, along with the dimensions they monitor:
| Metric | How to Measure | Which Dimension It Tracks |
| Error Rate | % of incorrect or invalid entries | Accuracy |
| Completeness Rate | % of filled required fields | Completeness |
| Consistency Check | Compare values across systems | Consistency |
| Data Age | Measure time since last update | Timeliness |
| Duplicate Count | Count of repeated records | Uniqueness |
| Validation Score | % of entries passing format/rule validation | Validity |
| Referential Integrity | Check if relationships between data points are correct | Integrity |
Once you calculate these metrics, you need to understand what the numbers mean. What score signals high quality data, what is far-fetched, and what’s acceptable? Compare your values with industry benchmarks to see where your data stands in terms of quality.
| Metric | Strong Benchmark | What This Means in Practice |
| Accuracy | 95–99%+ | Nearly all records reflect real-world values with minimal errors |
| Completeness | 90–98%+ | Critical fields are filled, with very few gaps |
| Consistency | 95%+ | Data matches across systems with rare conflicts |
| Timeliness | Near real-time or defined SLA | Data is updated within acceptable business timeframes |
| Validity | 95–100% | Entries follow required formats and rules |
| Uniqueness | 99–100% | Duplicate records are rare or eliminated |
These thresholds represent decision-grade data: good enough for analytics, reporting, and AI systems to operate confidently. Highly regulated industries, such as finance, healthcare, and aviation, among others, push closer to 99%+ standards, while other industries can tolerate slightly lower thresholds.
While these benchmarks signify high-quality data, the perfect score of 100% is most often unrealistic or not required. Data environments are dynamic, constantly evolving with new inputs, integrations, and human interaction.
The real goal isn’t perfection but rather fitness for purpose: data that is clean and reliable enough to support confident decision-making. Setting clear thresholds provides teams with a practical standard to work toward, with the helpful side effect of helping them focus improvements where they really matter-most, rather than wasting effort on diminishing returns. In modern analytics, progress and consistency outperform perfection every time.
Also Read: Data Observability: A Comprehensive Guide
Managing the Quality of Data by Mitigating Challenges
In real life, achieving high-quality data is easier said than done. For one thing, there is human error-typos, misentries, and inconsistent formatting are common, particularly when employees are manually typing in a large volume of information. And many businesses also depend upon managing multiple systems: CRM, ERP, marketing tools, spreadsheets, which makes consistency a huge challenge.
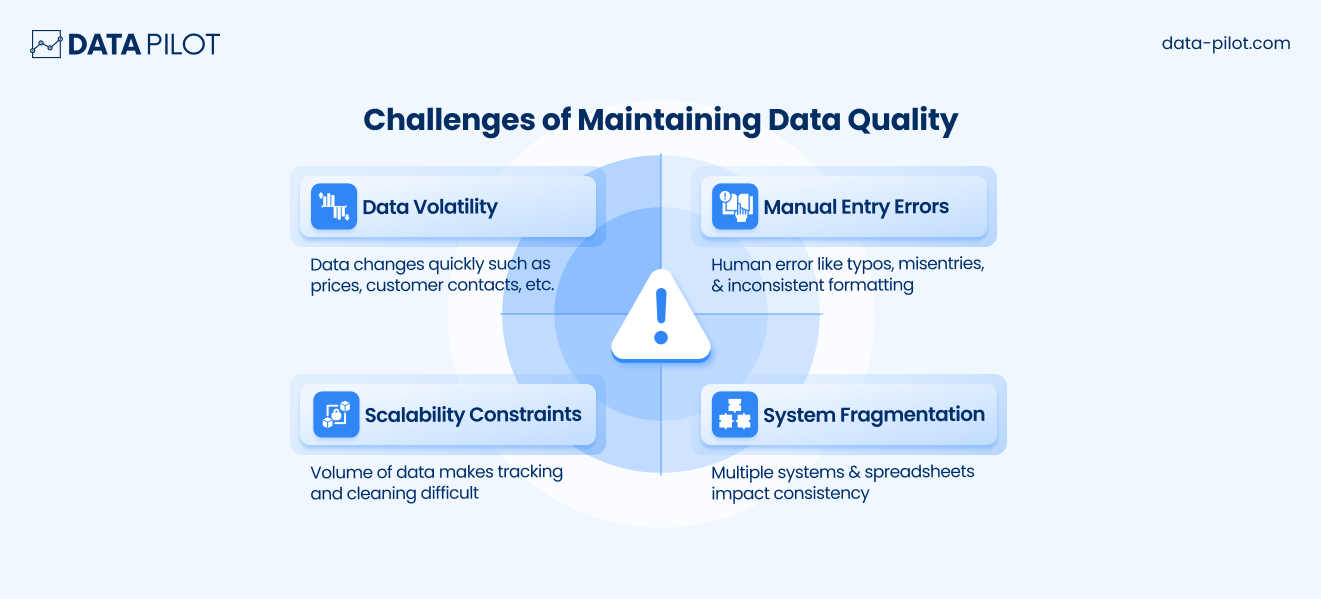
Data can also change quickly. Customer contact info, product prices, or inventory levels can shift daily, meaning even recently entered data can become outdated quickly. And as the volume of data grows, tracking and cleaning it becomes more complicated.
Imagine thousands or millions of entries in a system; manually verifying each one is impossible without automated tools and clear processes.
How Businesses Improve Data Quality
Businesses that prioritize data quality take a few key steps.
They define explicit standards for what constitutes “good data,” then train employees on why accuracy matters, use automated tools that flag errors or duplicates, and constantly monitor their data. The most successful companies link data quality to business outcomes directly. They ask themselves questions like: “If this data is wrong, what decisions will be affected?”
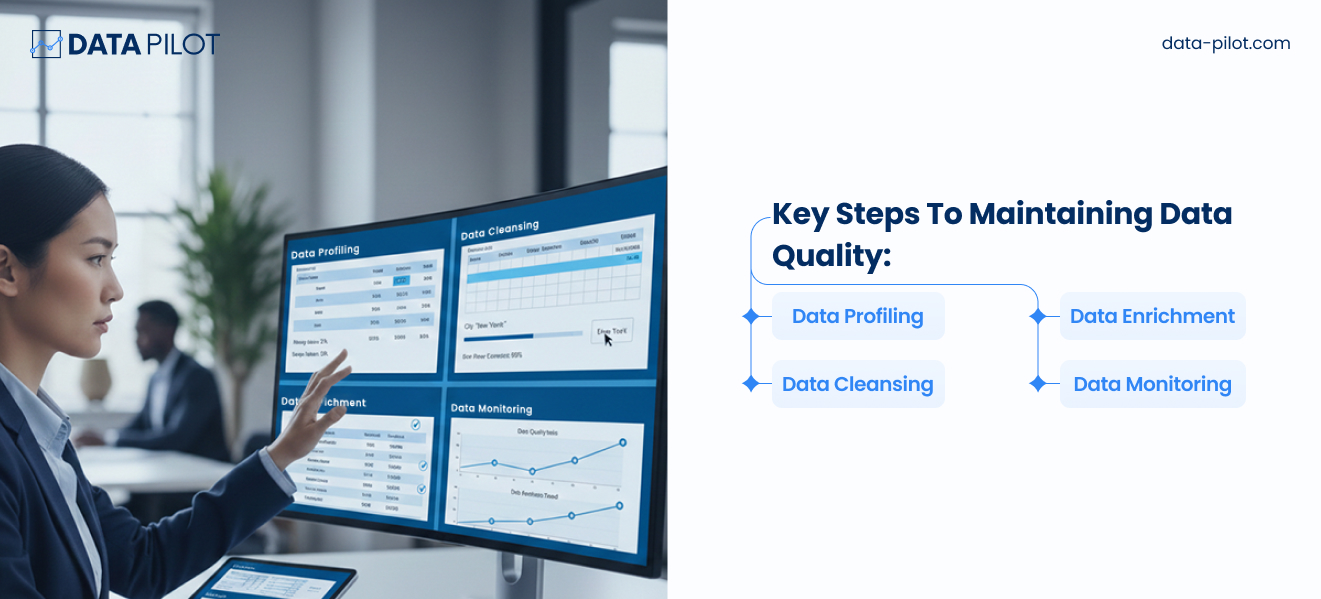
For instance, a bank that processes loan applications needs to ensure that all information regarding a customer is accurate and complete. Errors regarding credit scores, addresses, or income levels lead to bad decisions, possible legal implications, and dissatisfied customers. By establishing standards for data input, validation, and monitoring, the bank can minimize many of the errors and maximize outcomes. In fact, today’s data teams perform profiling, enrichment, cleansing, and monitoring in order to keep information accurate, complete, and decision-ready. Each of these practices answers a different stage of the data life cycle and thus works together in building trust in the data that fuels analytics and AI
The first step is data profiling. It is the process of examining a set of information. It is an analysis, if you like, of how a set of information is organized and how it behaves; a diagnostic test of how a set of information is, in its current state.
In this case, data enrichment adds value to the raw form because it often provides further context with additional attributes. This can be done by adding missing demographic data, verifying addresses, and even adding behavioral attributes. It is, therefore, enhancing unrefined data to offer deeper understanding and better decision-making.
Data cleansing focuses on correcting or removing inaccurate, duplicate, or incomplete records. It standardizes formats, resolves inconsistencies, and eliminates noise that can distort analytics. Cleansing ensures that teams are working with reliable information.
Data monitoring keeps quality from slipping over time. Automated checks continuously track key metrics, flag anomalies, and alert teams when thresholds are breached. Monitoring turns data quality into an active process instead of a reactive fix, helping organizations maintain confidence in their systems as data grows and evolves.
Together, these practices create a strong quality framework that supports trustworthy analytics, smoother operations, and AI systems that perform as intended.
The Age of AI and Analytics
Data drives the engine for smarter, faster, and strategic decisions. In current organizations, there has been a paradigm shift to data-first practices that provide reliable, timely, and actionable data. Advanced analytics dashboards help turn raw data into actionable insights in real-time with their help. Observability tools assist in automatic monitoring of data pipelines, as well as in preventing errors from affecting critical business decisions.
Off-the-shelf solutions are powerful, but every organization has unique needs. Custom data workflows and AI-driven cleaning processes help tailor data management to specific business goals. This ensures that data isn’t just collected, it’s strategically harnessed to drive growth, improve customer experiences, and uncover opportunities that competitors might miss.
In essence, AI and analytics are only as powerful as the data behind them. By adopting modern data practices and leveraging the right solutions, organizations can turn raw information into a strategic advantage, making every decision smarter, faster, and more confident.
Bringing It Together
In today’s business environment, where decisions are increasingly data-driven, high-quality data is a strategic asset. It impacts efficiency, profitability, customer satisfaction, and even regulatory compliance. Maintaining data quality requires attention, tools, and processes. But the payoff is significant: faster decisions, smarter AI, more satisfied customers, and reduced costs.
The takeaway is clear: companies that invest in understanding and improving data quality are better positioned to succeed in an increasingly competitive, analytics-driven world.
Want to build a strong data architecture and improve data quality? See how Data Pilot has done this for businesses like yours here.