
- Published:
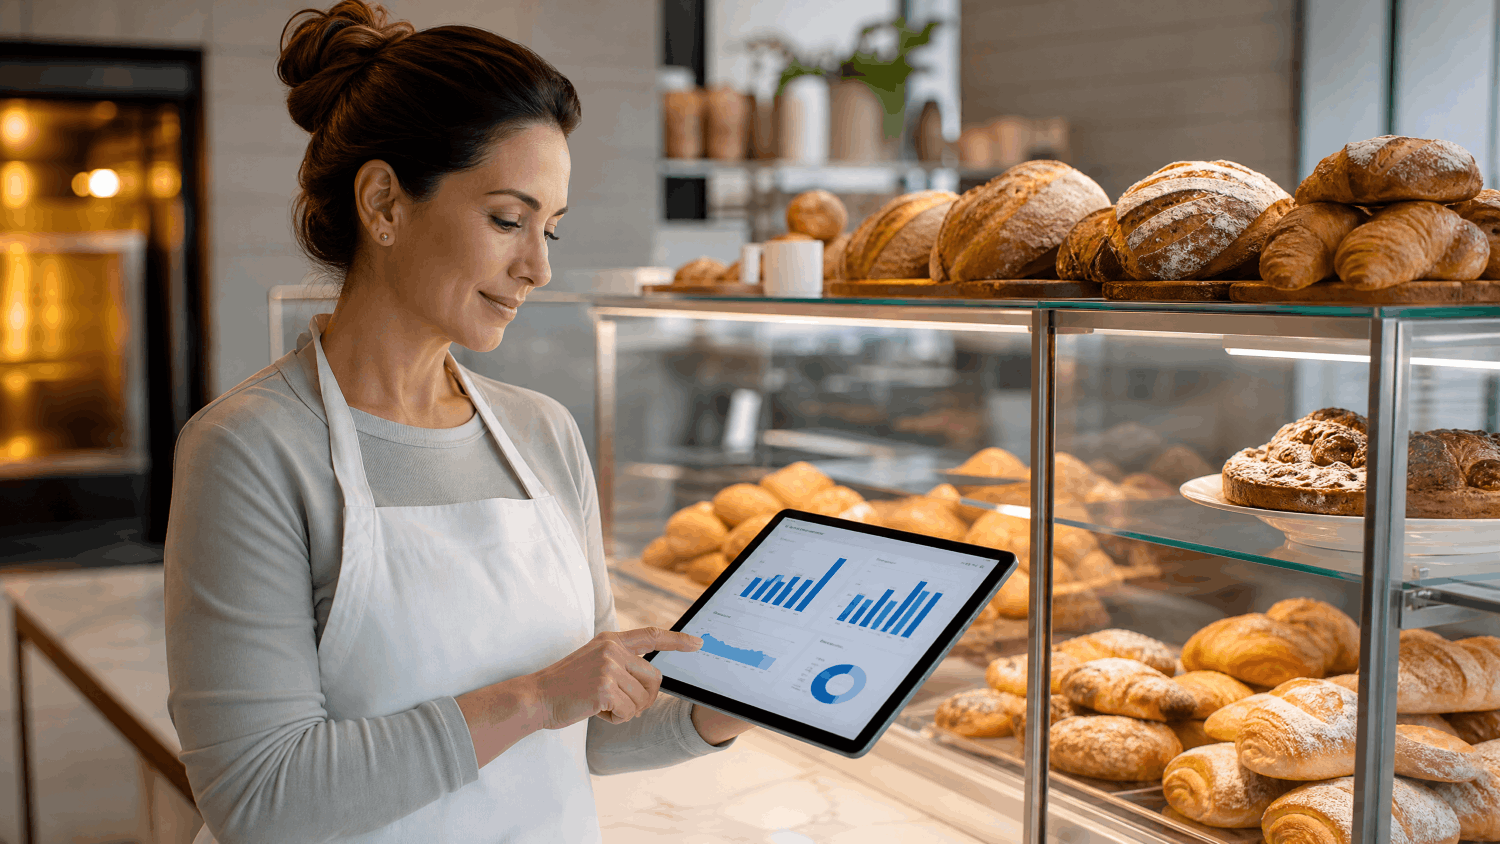
What Digital Transformation Means on the Bakery Floor and in the Display Case
Most bakery owners want fewer unsold goods at day end, clarity on which products make money, and purchasing that does not rely on memory. The label matters because it changes what you invest in and what you measure.
Technology is not the finish line. It is the support structure. The real work is changing how information moves through your operation so your baker knows what to produce, purchasing is tied to actual demand, and pricing decisions are fact-based.
A Simple Definition for Bakery Owners
Digital transformation connects your POS data, ingredient costs, production records, and labor hours so you bake closer to what you will sell, cost recipes accurately, and know which products and channels make money. It breaks into three areas:
Production Visibility: Production volumes informed by sales history, day-of-week patterns, and demand drivers—not last Tuesday’s habit.
Cost and Margin Clarity: Recipe costing, ingredient purchasing, and channel pricing based on data. You stop unknowingly subsidizing low-margin wholesale with high-margin retail capacity.
Decision Speed: Waste, margin, and labor numbers visible in one place so you make faster decisions about what to bake, order, and charge.
Example: whiteboard schedules become a connected planning view where yesterday’s sales automatically inform today’s batch sizes. Your baker starts with a data baseline and adjusts based on judgment. The gap between what you bake and what you sell narrows. Margin stays in the business.
Digitization vs. Automation vs. Transformation
These terms get used interchangeably, and that is how budgets disappear into projects that look busy but do not move margin or scale. Use this comparison to keep your investment honest:
| Work Type | What It Changes | Typical Tools | Typical ROI Pattern | Where It Fails |
| Digitization | Moves paper logs onto a screen or spreadsheet. | Google Sheets, basic POS, tablet forms, shared drives. | Quick wins in record-keeping and retrieval time. | Same broken process, just on a screen. Waste does not decrease. |
| Automation | Removes manual steps from known workflows, like auto-generating production sheets from sales. | POS integrations, automated purchase orders, basic scheduling tools, workflow connectors. | 2 to 4 hours per week recaptured, fewer ordering errors. | Automates bad decisions faster if data is incomplete or costs are wrong. |
| Transformation | Connects POS data, ingredient costs, labor, and waste into a unified view that changes how decisions are made. | Demand forecasting models, recipe costing platforms, BI dashboards, integrated data pipelines. | Compounding ROI: reduced unsold goods, improved gross margin, better labor utilization. | Requires clean data and owner buy-in. Fails without a clear first use case tied to measurable waste reduction. |
Owner’s Reality Check:
Never buy a new tool before you have clean sales data. If your POS data is incomplete, ingredient costs are outdated, or waste is not tracked by product, start there. Clean data is the foundation.
Why Bakery Economics Demand Better Data Now
Cost pressures and consumer expectations are squeezing margins from both sides. Ingredient inflation is persistent, labor costs are rising, and customers do not tolerate inconsistency. Several forces make the status quo increasingly expensive:

Rising Ingredient Costs:
Flour, butter, eggs, and specialty ingredients have seen significant price increases. Without automatic recipe costing updates, margin erosion happens silently. A $4.50 croissant may cost 18 to 25 percent more to produce today, but the price has not moved because no system flags the gap.

Labor Cost Pressure:
Labor is now a larger share of total cost. Without demand-driven scheduling, labor hours do not align to revenue. Overtime on slow days and understaffing on busy ones both destroy margin.

Perishable Product Economics:
Every unsold item is a permanent margin loss. Waste reduction is the highest-leverage financial improvement available to most bakeries.

Channel Complexity:
Retail counter, wholesale, online, and custom orders each have different margins. Without channel profitability data, owners grow the busiest channels, not the most profitable ones, trading high-margin retail for low-margin wholesale without realizing it.
The Cost of the Status Quo
The four pressures above create predictable operational leakage: unsold goods at zero margin, ingredient over-ordering, recipe underpricing, misaligned labor hours, and manual reporting overhead. These leaks compound quietly into significant financial drag. The good news: they are measurable and addressable.
Calculate your operational drag with this formula:
Monthly Leakage = (Unsold goods rate x Monthly Revenue x Gross margin) + (Over-order rate x Monthly Ingredient spend) + (Planning hours per week x 4.33 x Loaded labor rate)
For an illustrative bakery with $125,000 monthly revenue, 12% waste rate, 62% gross margin, $40,000 ingredient spend, 8% over-ordering rate, and 7 planning hours per week at $35/hour: estimated monthly leakage is $13,600.
Common scenario: 40 sourdough loaves baked on Tuesday based on last week’s numbers. A local school event that drove traffic last Tuesday does not repeat. Twenty loaves go unsold. Twelve donated, eight marked down 50%. The owner does not connect the event to demand until the following week, when the pattern repeats. Viewing this as predictable cost, not unavoidable cost, is the first step toward fixing it.
Calculate Your Weekly Cost
Use this calculator to estimate how much margin your bakery is losing each month to unsold goods, ingredient waste, and manual production planning. Adjust the inputs to match your actual numbers. The defaults are based on industry benchmarks for independent retail bakeries in the United States.
Bakery Waste and Margin Leakage Estimator
Estimate your monthly and annual economic leakage from unsold goods, ingredient waste, and manual planning overhead.
These figures are estimates based on the inputs you provide and industry benchmark assumptions. They should be validated against your actual financial data. This calculator is intended to illustrate the order of magnitude of the opportunity, not to provide a guaranteed outcome.
Deep-Dive Use Cases for Retail Bakeries
Not every data or analytics project delivers the same return. For a retail bakery, the highest-value improvements are concentrated in a small number of operational areas where financial leakage is both large and directly addressable. The five deep dives below are ordered by economic impact. Each one identifies the specific operational challenge, explains where the money is leaking, connects the problem to its root cause in data and systems, and describes what a practical fix looks like.
Where to Start:
If you can only fix one thing first, fix demand forecasting. It has the highest direct impact on margin, the fastest payback period, and it creates the data foundation that every other improvement in this guide depends on. Recipe costing, labor scheduling, and channel profitability all become more accurate once you have clean, reliable daily demand data.
Deep Dive 1: Demand Forecasting (Eradicating the Unsold Goods Tax)
The Challenge
Every bakery produces finished goods before knowing how many customers will walk through the door. Most owners set production based on a rough mental average, adjusted for what they remember. That fails on rainy Fridays, holiday weekends, local events, or the week after catering inflated numbers.
The Solution
A demand forecasting program connects your POS history to a statistical model that predicts daily sales by product, accounting for day-of-week patterns, seasonal trends, and known demand drivers. Your baker uses the daily production recommendation as a starting point and adjusts based on judgment. Accuracy improves as the model learns from actual versus predicted sales.
The Bakery Example
A bakery producing 40 sourdough loaves daily based on habit discovers through POS analysis that Tuesday demand averages 22 loaves, Saturday averages 58. A day-of-week model reduces Tuesday waste from 18 to 4 loaves and eliminates Saturday sellouts. Both problems were invisible without data.
Measurable Business Impact
- Reduced Unsold Goods: Daily waste volume decreases as production aligns with actual demand.
- Margin Recovery: Waste reduction translates directly to recovered gross margin. (Assumption: Uses gross margin as proxy for margin lost on unsold goods. Does not account for partial markdown recovery, donations, tax effects, or implementation cost.)
- Improved Availability: Fewer sellouts on high-demand days mean fewer customers who leave empty-handed.
Best-Fit Services
Recommended First Pilot (6-8 Weeks)
Extract 12 to 18 months of daily POS sales data by product category. Clean and standardize the data. Build a day-of-week and seasonal demand model for your top 10 highest-waste SKUs. Deliver a daily production recommendation sheet that your baker can use as a starting point each morning. Track actual versus predicted sales for 30 days and measure waste reduction.
Deep Dive 2: Recipe and SKU Profitability (Stopping the Margin Blind Spot)
The Challenge
Most owners know which products sell well. Few know which are actually profitable. A $4.50 croissant costing $0.80 in ingredients looks great until you factor in 12 minutes of skilled labor, proofing, packaging, and oven energy. Your best sellers may not be your most profitable items.
The Solution
A recipe costing program connects ingredient purchase data to your recipe database and POS history, producing an item-level P&L for every SKU. When ingredient prices change, the system flags which items are most affected. You make data-driven pricing decisions, identify which specialty items deserve more display space, and retire or reprice items silently subsidized by higher-margin products.
The Bakery Example
Recipe costing reveals that a signature almond croissant has 38% gross margin after labor, while plain butter croissant runs at 61%. The almond croissant is underpriced by $1.20. A $1.00 price increase on 80 units per day adds $2,400 per month in gross margin with no production change.
Measurable Business Impact
- Margin Recovery via Repricing: Identifying and correcting underpriced SKUs improves blended gross margin without changing production volume.
- Mix Optimization: Production shifts toward high-margin items improve profitability without increasing revenue or headcount.
- Cost Visibility: Real-time cost alerts prevent margin erosion from going undetected when ingredient prices change.
Best-Fit Services
Recommended First Pilot (6-8 Weeks)
Build a recipe cost model for your top 20 SKUs by revenue. Connect current ingredient purchase prices from your supplier invoices. Produce an item-level profitability report showing gross margin and contribution margin per unit. Identify the top 5 underpriced items and deliver a repricing recommendation with estimated margin impact. Estimated setup time: 6 to 8 weeks with access to POS data and supplier invoices.
Deep Dive 3: Ingredient Purchase Planning (Controlling the Over-Order Drain)
The Challenge
Ingredient purchasing is driven by habit and risk aversion, not demand data. Owners order more than needed to avoid running out mid-production. Result: ingredients that spoil, working capital tied up in perishable inventory, and COGS higher than necessary.
The Solution
A purchase planning program connects your demand forecast to bill-of-materials, calculating exact ingredient quantities required and accounting for inventory levels, supplier lead times, and minimum order quantities. As demand forecasting improves, purchase planning precision improves, reducing the safety stock buffer that drives over-ordering.
The Bakery Example
When demand forecasts connect to bill-of-materials, ingredient orders align with actual production. Example: butter purchases running 22% above usage can be reduced 18% through demand-driven ordering, saving $640 per month. Across the full ingredient list, similar reductions add up to significant working capital recovery.
Measurable Business Impact
- Reduced Ingredient Waste: Ingredient over-ordering decreases when purchase quantities align with actual production demand.
- Working Capital Improvement: Lower inventory levels free up cash previously tied up in perishable stock.
- COGS Reduction: Ingredient spend aligned with actual production directly improves gross margin percentage.
Best-Fit Services
Recommended First Pilot (6-8 Weeks)
Build a bill-of-materials for your top 15 SKUs by production volume. Connect the demand forecast to calculate weekly ingredient requirements. Compare recommended purchase quantities against actual orders for 4 weeks to measure the over-ordering gap. Deliver a purchase recommendation report that the owner can use as a starting point for weekly supplier orders. Estimated setup time: 8 to 10 weeks, building on an existing demand forecasting foundation.
Ready to See Your Actual Numbers?
Our team can run a free Bakery Waste and Margin Assessment using your real POS and cost data. We will identify your top three leakage areas and estimate the recoverable value in your specific operation, with no commitment required.
Deep Dive 4: Labor Scheduling (Aligning Staffing to Demand Patterns)
The Challenge
Labor is the second-largest cost and hardest to optimize without reliable demand data. If production is misaligned with demand, you get overtime on slow days or scrambling on busy days. Both scenarios are expensive and preventable.
The Solution
Connect your demand forecast to labor scheduling to build a staffing model that adjusts hours based on expected sales. High-volume Saturday: schedule additional production and retail staff. Slow Tuesday: reduce early production hours. Result: tighter alignment between labor cost and revenue, less overtime, adequate coverage on busy days.
The Bakery Example
A simple three-tier staffing model based on forecasted daily revenue aligns hours to expected demand. Staffing matched to demand improves labor efficiency on low-volume days and customer service on high-volume days.
Measurable Business Impact
- Overtime Reduction: Labor scheduling efficiency improves when staffing aligns with forecasted demand, reducing unplanned overtime.
- Idle Time Elimination: Reducing early-morning overstaffing on slow days recaptures paid labor hours with no production impact.
- Revenue Protection: Adequate staffing on high-demand days prevents sellouts and wait times that drive customers to competitors.
Best-Fit Services
Recommended First Pilot (6-8 Weeks)
Build a labor demand model that maps expected daily sales volume from your demand forecast to recommended production and retail staffing hours. Start with a simple three-tier lookup table: low, medium, and high volume days, each with a recommended staffing template. Track actual versus scheduled hours for 60 days and measure overtime reduction and idle time improvement. Estimated setup time: 8 to 10 weeks, building on an existing demand forecasting foundation.
Deep Dive 5: Channel Profitability (Separating Retail, Wholesale, and Custom Order Margins)
The Challenge
Most bakeries operate across multiple channels: retail counter, wholesale, and custom orders. Each has different cost structure and margin profile. Without channel profitability data, owners cannot decide which channels to grow, reprice, or exit. Common mistake: grow wholesale for predictable revenue, not realizing it consumes high-margin retail capacity at lower net margin.
The Solution
A channel profitability program builds a cost allocation model that assigns ingredient costs, labor, packaging, and delivery to each channel based on actual usage. It produces a channel-level P&L showing gross margin, net margin, and contribution margin. Owners make data-driven decisions about wholesale pricing, minimum order quantities, delivery fees, and channel mix.
The Bakery Example
Channel profitability often reveals wholesale accounts running at significantly lower margins than retail after accounting for delivery and packaging. Renegotiating pricing on low-margin accounts or redirecting capacity to higher-margin channels improves profitability.
Measurable Business Impact
- Margin Recovery via Channel Mix: Repricing or exiting unprofitable wholesale accounts improves blended gross margin through better channel mix.
- Capacity Reallocation: Capacity freed from low-margin wholesale can be redirected to higher-margin retail or custom orders.
- Pricing Confidence: Channel-level cost data supports confident wholesale pricing negotiations rather than guesswork.
Best-Fit Services
Recommended First Pilot (6-8 Weeks)
Build a channel-level cost allocation model using 3 months of actual sales, labor, ingredient, and delivery data. Produce a channel P&L showing gross and net margin by retail, wholesale, and custom orders. Identify the top 3 wholesale accounts by revenue and calculate their true net margin after full cost allocation. Deliver a channel pricing and mix recommendation. Estimated setup time: 8 to 10 weeks with access to POS, payroll, and accounting data.
The Business Case: Benefits and Tradeoffs of Retail Bakery Transformation
A transformation strategy yields clear business outcomes: improved gross margin, lower ingredient spend, better labor utilization, scalable revenue growth without proportional headcount increase. You are buying speed, accuracy, and repeatability in daily production and purchasing decisions.
Benefits of Retail Bakery Transformation
You need outcomes that tie to margin, cash, and scale. Expect these results:
- Recover margin from waste reduction: Demand forecasting reduces the volume of finished goods that leave the building at zero or negative margin. Metric target: Reduce unsold goods rate.
- Improve pricing accuracy: Recipe costing identifies underpriced SKUs and flags when ingredient cost increases have eroded margin. Metric target: Identify and reprice underpriced SKUs.
- Reduce ingredient spend: Demand-driven purchase planning aligns ingredient orders with actual production, reducing over-ordering and spoilage. Metric target: Reduce ingredient over-ordering rate.
- Improve labor efficiency: Demand-aligned scheduling reduces overtime on slow days and idle time from early production finishes. Metric target: Reduce unplanned overtime.
- Recapture owner time: Automated reporting eliminates 5 to 8 hours per week of manual data reconciliation, freeing the owner for decisions that generate revenue rather than reporting that describes the past. Metric target: Reduce weekly reporting time.
If you cannot tie a project to one of these outcomes, it is noise.
What Retail Bakery Transformation Really Costs
Most owners budget for software subscriptions, then are surprised when the real investment shows up in data cleanup, integration work, and process change. Software is the easy part. Changing how a baker uses a production sheet or how you make purchasing calls is the hard part. Plan for these cost categories:
- Software and subscriptions: POS integrations, recipe costing, BI tools, forecasting software.
- Data cleanup: Standardize product names, correct historical sales data, build clean recipe database with current costs.
- Integration work: Connect POS, supplier invoices, payroll, and production records so data flows automatically.
- Process redesign: Define the new daily workflow, who owns the forecast, how exceptions are handled.
- Training and adoption: Consistent reinforcement until the new process becomes default habit.
- Ongoing administration: Keep ingredient costs current, maintain recipe accuracy, manage user access as staff turns over.
CAPEX vs. OPEX:
One-time build cost covers setup, migration, integration. Ongoing run cost covers subscriptions, support, data maintenance. Budget for both from the start.
Pro Tip:
Set aside 20 to 30% of budget for integration and data cleanup, 15 to 20% for training and adoption. Most projects stall here.
Common Challenges of Bakery Transformation
Most transformation failures are not technology problems. They come from: unclear ownership, too much scope, messy data, weak adoption. Plan for these early to avoid months of operational churn.
Automating a Broken Process
Automating a broken process just creates faster guesswork. A forecast built on incomplete POS data produces confident-looking wrong recommendations.
Prevention: Audit and standardize sales data manually before building any model. Fix top data quality issues first: product naming, void and refund handling, catering separation.
Trying to Do Everything at Once
Implementing everything simultaneously introduces too much change. Projects stall, adoption fails, owner reverts to old process.
Prevention: Build a phased roadmap tied to one value stream at a time. Start with demand forecasting. Prove waste reduction. Then add recipe costing, then labor scheduling. Each wave builds on the previous.
Stale Recipe Costs
A recipe costing system not updated when prices change is worse than no system. It gives false confidence while margin erodes silently.
Prevention: Assign one person to own cost updates, set monthly review cadence. Connect supplier invoices to the model so updates happen automatically.
Tool Sprawl Without a Plan
Tool sprawl creates more logins, manual reconciliation, and disagreements between numbers.
Prevention: Keep simple architecture. Require clear business reason for every tool. Verify it reduces manual steps across the full workflow, not just creates another silo.
Baker and Staff Resistance
Experienced bakers resist data recommendations if they feel it undermines their judgment or implies their instincts are wrong. If the new process feels like surveillance, adoption fails.
Prevention: Position the forecast as a starting point the baker adjusts, not a mandate. Involve your head baker in pilot design. Explain the financial benefit plainly. When waste reduction translates to job security and less end-of-day stress, adoption follows.
Weak Data and No Single Source of Truth
Duplicate product names, inconsistent waste tracking, and mixed catering/retail data produce a demand signal the model cannot trust.
Prevention: Define data quality rules before you start. Assign data ownership. Fix top drivers first: product naming, waste recording by SKU, catering separation. Clean data is the foundation.
No Success Metrics Before You Start
Without a clear baseline and metrics, you cannot know if transformation is working or build the case for next phase investment.
Prevention: et success metrics before the pilot begins. Capture current waste rate, planning hours, ingredient over-ordering percentage. Hold monthly reviews. That rhythm prevents drift and builds evidence for the next wave.
When You See ROI and What to Expect at Each Stage
The most common question: how long until you see financial return? It depends on where you start, how clean your data is, and how quickly your team adopts. The timeline below reflects what is achievable for a well-run independent bakery with reasonably complete POS data and an engaged owner.
Days 1-30: Foundation and Baseline
Data Audit, Baseline Metrics, and Quick Wins
Establish a clean starting point. Audit POS data for completeness and consistency, standardize product names, begin tracking waste by SKU. Capture baseline metrics: waste rate, planning hours, ingredient over-ordering percentage. No financial return yet, but this prevents the most common failure: building a model on bad data. Quick wins emerge from reviewing historical sales and identifying obvious production mismatches.
Days 31-90: First Pilot and Early Returns
Demand Forecasting Live, Waste Reduction Begins
The demand forecasting pilot goes live for your top 10 highest-waste SKUs. Your baker uses the daily production recommendation as a starting point. Reduce unsold goods and compare before-and-after results. This is the inflection point where the investment begins to pay for itself.
Months 4-6: Expanding the Foundation
Recipe Costing and Purchase Planning Added
With demand forecasting producing reliable daily signals, you add recipe costing and purchase planning in months 4 to 6. Recipe costing identifies underpriced SKUs and flags ingredient cost increases that have eroded margin. Purchase planning connects the demand forecast to ingredient orders, reducing over-purchasing. These improvements target a measurable increase in blended gross margin from waste reduction, repricing, and ingredient spend reduction. For an illustrative bakery with $1.5 million in annual revenue, this represents a potential increase in annual profit.
Months 7-12: Labor, Channels, and Reporting
Full Operational Integration and Compounding Returns
The third wave adds labor scheduling, channel profitability analytics, and automated reporting. Labor scheduling reduces labor cost. Channel profitability identifies wholesale accounts at unacceptable margins. Automated reporting recaptures owner time. By month 12, all three waves target overall net margin improvement and a shift from operational administration to strategic work.
Month 12 and Beyond: Compounding and Scale
Continuous Improvement and Scalable Operations
After 12 months, shift from implementation to continuous improvement. The demand model becomes more accurate as it accumulates data. Recipe costs stay current through embedded monthly updates. Labor scheduling improves as the model is refined. The most significant long-term benefit: scalability. A bakery with connected data can add a second location, new wholesale account, or new product line without proportionally increasing owner burden. Infrastructure built for one location scales to two or three with incremental effort.
The Hidden Cost of Doing Nothing:
The status quo is not free. Every week without demand forecasting, recipe costing, and waste tracking, you pay a margin tax that compounds quietly.
The Core Pillars of a Retail Bakery Digital Strategy
A retail bakery digital strategy is not a technology checklist. It is a set of connected operational capabilities that create compounding improvement in margin, efficiency, and decision quality. The four pillars below are the minimum viable foundation for a bakery that wants to operate on data, not habit.
Pillar 1: Clean, Connected Sales Data
Every other capability depends on accurate, consistent, complete sales data at the product level. A POS system that captures daily sales by SKU, handles voids and refunds correctly, and separates catering and wholesale from daily retail. Product names standardized so “Sourdough Loaf,” “Sourdough,” and “S/D Loaf” are recognized as the same item. Waste recorded daily by product category. Clean data is not glamorous, but it determines whether everything else is possible.
Key capabilities: POS standardization, daily waste tracking by SKU, catering and wholesale separation, data completeness audit.
Pillar 2: Demand Forecasting and Production Planning
The second pillar converts clean sales data into actionable production guidance. A demand model analyzes sales patterns by day of week, season, and demand drivers to produce daily production recommendations. These are not mandates; they are data-informed starting points your baker adjusts based on judgment. As the model learns, the gap between what you bake and what you sell narrows. This pillar drives waste reduction and the most direct path to margin improvement.
Key capabilities: Day-of-week modeling, seasonal adjustment, event calendar integration, actual versus forecast tracking, daily recommendations.
Pillar 3: Recipe Costing and Profitability Visibility
The third pillar connects ingredient costs to product pricing so you always know the true margin on every item. A recipe costing system maintains current cost-to-produce for every SKU, updated automatically when prices change. It produces item-level profitability reports showing gross margin, contribution margin, and pricing gaps. This pillar drives pricing decisions, mix optimization, and identifies products silently subsidizing others. It also provides cost data for purchase planning and channel profitability systems.
Key capabilities: Recipe database with current costs, automatic cost updates, item-level P&L, pricing gap alerts, mix optimization recommendations.
Pillar 4: Operational Reporting and Decision Support
The fourth pillar connects all of the above into a single operational view for faster, more confident decisions. A daily dashboard shows yesterday’s sales versus forecast, waste by category, labor hours versus revenue, and alerts for metrics outside expected ranges. Weekly and monthly summaries are generated automatically. This eliminates hours of manual reporting and replaces it with a single source of truth that is always current. It provides visibility to detect problems early.
Key capabilities: Automated daily dashboard, waste and margin alerts, weekly summary automation, labor versus revenue tracking, channel-level P&L visibility.
Implementation Roadmap: From First Pilot to Full Operation
The roadmap below is designed for an independent bakery with one to three locations, a working POS system, and an owner ready to commit 2 to 4 hours per week during implementation. It is not rigid; it is a sequenced starting point you adapt to your situation, data quality, and team capacity.
| Phase | Timeframe | Focus | Key Deliverables | Success Metric |
| Phase 1 | Weeks 1-4 | Data Audit and Baseline | POS data quality report, standardized product list, waste tracking process, baseline metrics document | 12 months of clean daily sales data by SKU available for modeling |
| Phase 2 | Weeks 5-12 | Demand Forecasting Pilot | Day-of-week demand model for top 10 waste SKUs, daily production recommendation sheet, actual vs. forecast tracking dashboard | Measurable reduction in unsold goods rate on piloted SKUs |
| Phase 3 | Weeks 13-20 | Recipe Costing and Repricing | Recipe cost database for top 20 SKUs, item-level profitability report, pricing gap analysis, repricing recommendations | Underpriced SKUs identified and repriced |
| Phase 4 | Weeks 21-28 | Purchase Planning | Bill-of-materials for top 15 production SKUs, demand-driven purchase recommendation report, over-ordering baseline vs. actual comparison | Measurable reduction in ingredient over-ordering rate |
| Phase 5 | Weeks 29-36 | Labor Scheduling Integration | Three-tier demand-to-staffing model, weekly schedule recommendation output, overtime and idle time tracking | Measurable reduction in unplanned overtime |
| Phase 6 | Weeks 37-48 | Channel Profitability and Reporting Automation | Channel-level P&L by retail, wholesale, and custom orders; automated daily dashboard; weekly summary email; channel pricing recommendations | Owner reporting time reduced; channel margin visibility established |
Step-by-Step: How to Execute Phase 1
Phase 1 determines the quality of everything that follows. Here is how to execute it:
- Export and review 12 to 18 months of POS transaction data. Look for inconsistent product names, missing categories, and days with unusually high void or refund rates. Document every product name variation and create a standardized list that maps all variations to a single canonical name.
- Separate catering and wholesale revenue from daily retail sales. If your POS does not distinguish between channels automatically, create a manual tagging process. Catering and wholesale have fundamentally different demand patterns and will distort your model if mixed.
- Implement a daily waste tracking process. A simple tablet form or shared spreadsheet where the closing baker records unsold quantities by product category is sufficient. The key is consistency: same person, same time, same categories, every day.
- Capture your baseline metrics before you change anything. Record current waste rate, planning hours per week, and ingredient over-ordering percentage. Without them, you cannot demonstrate value or build the case for the next phase.
The Most Important Rule:
Do not move to Phase 2 until Phase 1 is complete. A model built on incomplete or inconsistent data will produce confident-looking wrong recommendations. Time spent on data quality in Phase 1 is the highest-leverage investment in the entire program.
Conclusion
Bakery economics are demanding. The most significant sources of margin leakage—unsold goods, ingredient over-ordering, recipe underpricing, manual planning overhead—are not structural. They are information problems, and information problems have practical, affordable solutions.
This transformation connects the data your bakery already generates so morning decisions are fact-based, not memory-based. Start with demand forecasting and waste reduction, prove the return, and build from there. Bakeries that grow profitably combine craft with operational intelligence: they know which products make money and how close to actual demand they are baking.
Ready to Recover Your Margin?
Our team works with independent and multi-location retail bakeries to identify their highest-value data opportunities and build practical, affordable improvement programs. Start with a free Bakery Waste and Margin Assessment using your actual POS and cost data.