
Your TMS knows where shipments were booked. Your WMS knows what left the dock. Your carrier portal knows what is in transit. Your ERP knows what was billed. None of them talk to each other. So when a shipment goes late, you find out from the customer, not from your own system.
This guide shows you how to fix that. Not by adding another tool, but by connecting your POS data, food cost records, labor hours, and delivery platform reports so your operations team makes decisions based on facts. You will find a cost calculator, five deep-dive use cases ordered by economic impact, a realistic ROI timeline, and a six-phase roadmap you can start this quarter.
- Published:
What Digital Transformation Means for 3PLs and Logistics Providers
A Simple Definition for 3PL Operators
Digital transformation is connecting your POS data, food cost records, labor hours, delivery platform reports, and location-level financials so you can manage food cost accurately, schedule labor to demand, understand which menu items and channels are actually profitable, and identify which locations need attention before the monthly P&L tells you it is too late. That definition forces you to think beyond tools, and it breaks into three practical areas:
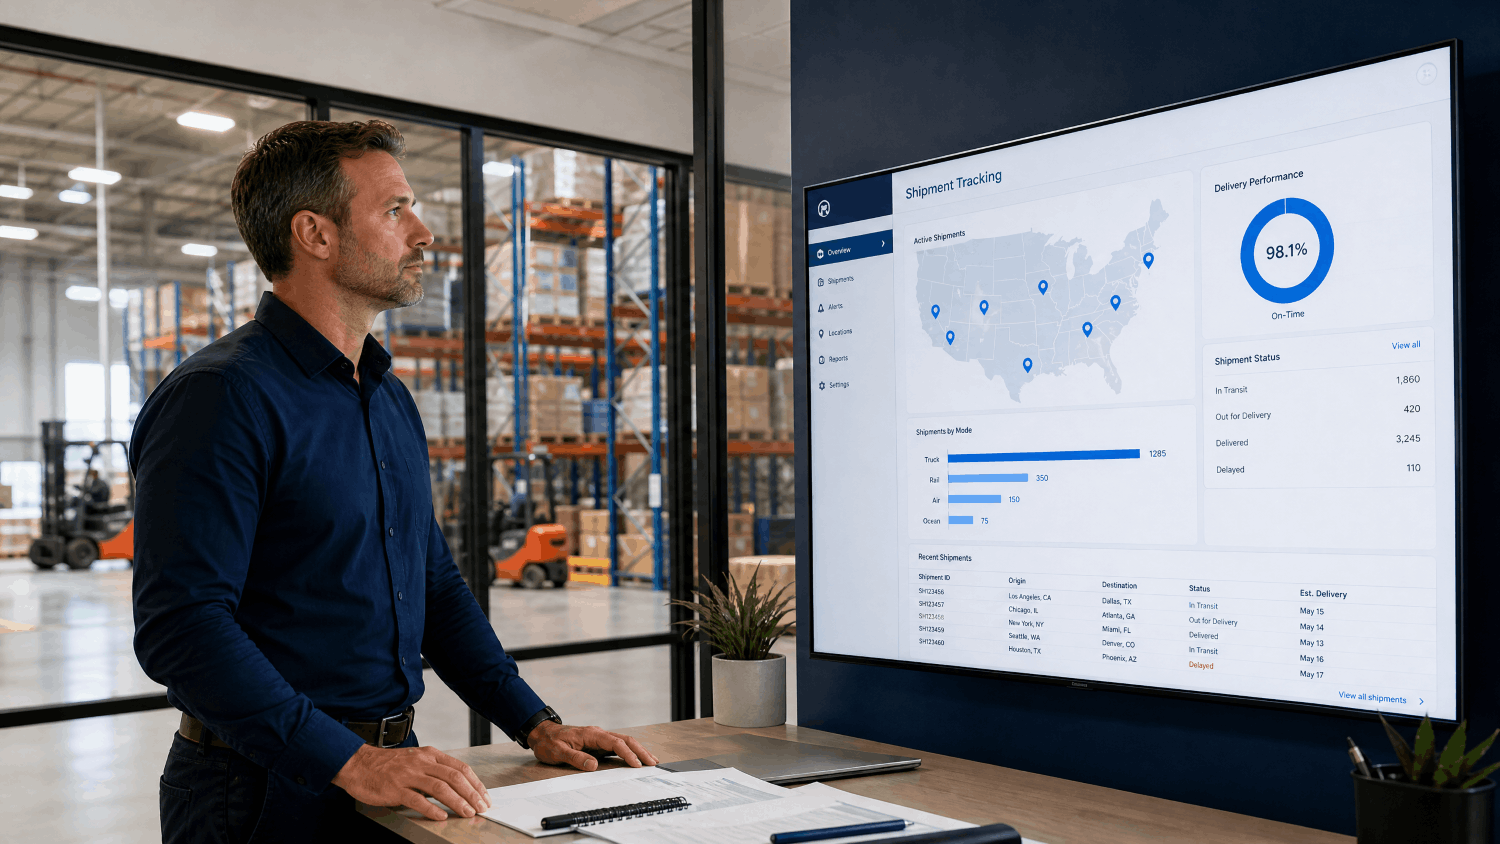
Real-Time Operational Visibility: Your operations director should not learn about a late shipment from a customer escalation. Transformation means shipment status, SLA risk, and carrier exceptions are visible in one place, updated automatically, and flagged before the delivery window closes.
Customer and Lane Profitability: This is the financial engine of your business. Transformation removes the guesswork from pricing decisions, capacity allocation, and customer relationship management. You stop growing revenue on lanes and accounts that are eroding margin without knowing it.
Automated Exception Management: You stop managing exceptions by monitoring carrier portals and email threads. Transformation means at-risk shipments are flagged automatically, customer updates are triggered by data rather than by a staff member checking a screen, and root cause data is captured for every exception so patterns can be identified and addressed.
In practice: instead of an operations coordinator spending six hours a week pulling shipment status from three carrier portals and updating a shared spreadsheet, your operations director opens one view and sees every in-transit shipment, its current status, its SLA deadline, and a flag on any shipment where the carrier’s last scan puts delivery at risk. They act on the flag before the window closes, not after it has already passed.
Digitization vs. Automation vs. Transformation
These three terms get used interchangeably. That is how budgets disappear into projects that look busy but do not move margin. Use this table to keep your investment honest:
| Work Type | What It Changes | Typical Tools | Typical ROI Pattern | Where It Fails |
| Digitization | Moves paper load boards, carrier check-in logs, and manual shipment tracking onto a screen or shared spreadsheet. | Google Sheets, shared drives, basic TMS reporting, carrier portal logins. | Faster retrieval, easier sharing. No reduction in late deliveries, expedite spend, or manual tracking hours. | You keep the same disconnected process across systems. The data is easier to find but still wrong, still late, and still siloed by carrier. |
| Automation | Removes manual steps inside a known workflow, such as auto-generating a daily shipment status report from TMS and carrier tracking data. | TMS integrations, automated carrier status feeds, scheduling tools, reporting connectors. | Strong ROI on specific tasks: manual tracking hours reduced, fewer data entry errors, faster customer updates on routine shipments. | If carrier data feeds are inconsistent or shipment status codes differ across carriers, you automate inaccurate reporting faster. Exceptions still require manual triage. |
| Transformation | Changes how shipment performance, customer profitability, and carrier cost decisions are made by connecting TMS, WMS, ERP, and carrier data into a unified operational and financial view. | Multi-carrier BI dashboards, real-time exception detection, customer and lane profitability models, integrated data pipelines. | Compounding impact: reduced late delivery cost, lower expedite spend, recaptured operations staff time, and pricing decisions grounded in actual cost-to-serve data. | Requires consistent shipment status codes and carrier data standards. Fails without operations leadership buy-in and a clear first use case tied to measurable cost reduction. |
Operator’s Reality Check:
The most common mistake 3PL operators make is building a shipment visibility dashboard before they have consistent, comparable data across carriers. If your carrier status codes are not standardized, your TMS shipment records do not match your billing records, or your ERP cost allocations do not include accessorial charges, start there. Consistent data standards across carriers and systems are the foundation. Everything else builds on them.
Why 3PL Economics Demand Better Data Now
Running a 3PL is a margin business operating on thin spreads with high operational complexity. The economics are unforgiving when data is fragmented, and four structural problems make the status quo increasingly expensive as volume grows:

Fragmented TMS, WMS, ERP, and Carrier Data Creates a Blind Spot Between Booking and Delivery
Each system in a typical 3PL operation captures a different slice of the shipment lifecycle. The TMS records the booking. The WMS records the pick, pack, and outbound scan. The carrier portal records in-transit status. The ERP records the billing. None of these systems are connected in real time, which means the operations team is always working from a partial picture. Exceptions are identified reactively, after the SLA has been missed, because there is no system watching the full shipment lifecycle and flagging risk before the window closes.

Expedite Spend and Late Delivery Costs Compound Without Real-Time Exception Detection
When a shipment is at risk, the cost of intervention rises sharply with time. A carrier delay identified 48 hours before the delivery window can often be resolved with a reroute or a carrier swap at standard cost. The same delay identified after the window has closed requires an expedite, a customer credit, or both. For operations running on thin margins, the difference between proactive and reactive exception management is the difference between a recoverable cost and a margin event. Without real-time visibility, the default is always reactive.

Customer and Lane Profitability Is Invisible, So Pricing and Capacity Decisions Are Made on Revenue Volume Rather Than Margin
Most 3PLs price by rate card and manage relationships by revenue volume. The problem is that revenue volume is not margin contribution. A high-volume customer with complex accessorial requirements, frequent exceptions, and a demanding service level agreement may be generating significantly less margin per shipment than a smaller customer with straightforward freight and low exception rates. Without a customer-level cost-to-serve model that allocates carrier cost, accessorial charges, and exception handling, pricing decisions are made on incomplete information and capacity is allocated to the wrong relationships.

Manual Tracking and Customer Update Workload Consumes Operations Capacity That Should Be on Exception Resolution
Operations staff at most 3PLs spend a significant portion of their week pulling shipment status from carrier portals, updating shared tracking spreadsheets, and responding to customer inquiries about shipment location. This work is necessary but largely automatable. Every hour spent on routine status updates is an hour not spent on exception triage, carrier escalation, or the proactive customer communication that protects SLA performance and client relationships.
The Cost of the Status Quo
The four problems above translate directly into monthly financial leakage. For most regional 3PLs, the combined monthly cost of late delivery penalties, uncontrolled expedite spend, and manual tracking overhead is calculable and largely addressable. The formula below makes that visible.
The 3PL Operational Leakage Formula:
Monthly Leakage = (Monthly shipments × Late delivery rate × Cost per late delivery) + Monthly expedite spend + (Operations staff × Manual tracking hours/week × 4.33 × Loaded hourly rate)
Using the planning assumptions in the calculator below (500 monthly shipments, 8% late delivery rate, $320 cost per late delivery, $12,000 monthly expedite spend, 4 operations staff each spending 6 hours per week on manual tracking at $38 per hour), this formula produces an estimated monthly leakage of approximately $28,749 (exact: $28,748.96). That is a planning assumption, not a benchmark. Use the calculator to run your own numbers.
Consider a common scenario: a regional 3PL with 500 monthly shipments learns on a Friday afternoon that a key customer’s shipment missed its Thursday delivery window. The carrier flagged a delay two days earlier, but no one in the operations team saw the alert because it was buried in a carrier portal inbox that gets checked twice a day. An expedite is arranged at a cost of $840. If the customer credit and manager escalation time add roughly $360, the total direct cost approaches $1,200 before relationship impact. Your actual cost should be calculated using the expedite charge, credit amount, loaded manager time, and any SLA penalty. Multiply that pattern across a month and the leakage becomes structural.
$12,800
Estimated monthly late delivery cost in the planning example (500 shipments, 8% late rate, $320/incident)
$12,000
Monthly expedite spend in the planning example — use your own figure in the calculator
~$3,950
Monthly manual tracking cost in the planning example (4 staff × 6 hrs/week × 4.33 × $38)
~$28,750
Total estimated monthly leakage in the planning example ($12,800 + $12,000 + $3,949)
Calculate Your Monthly Operational Leakage
Use this calculator to estimate how much your operation is losing each month to late delivery costs, expedite spend, and manual tracking overhead. Adjust the inputs to match your actual numbers. The defaults are planning assumptions based on the example company used throughout this guide. They are not industry benchmarks.
3PL Operational Leakage Estimator
Estimate your monthly and annual leakage from late deliveries, expedite spend, and manual tracking. All inputs are editable. All formulas are shown in the disclaimer below.
Formulas: Monthly late delivery cost = Monthly shipments × (Late delivery rate ÷ 100) × Cost per late delivery. Monthly manual tracking cost = Operations staff × Tracking hours per week × 4.33 × Blended hourly cost. Total monthly leakage = Late delivery cost + Expedite spend + Manual tracking cost. Annual leakage = Monthly leakage × 12. Potential recovery = Total monthly leakage × 25%. All figures are estimates based on your inputs. Assumption: To avoid double-counting, do not include expedite costs inside Cost per Late Delivery if you also enter Monthly Expedite Spend separately. The 25% recovery assumption is illustrative only and is not a guaranteed outcome.
Deep-Dive Use Cases for 3PLs and Logistics Providers
The five use cases below are ordered by likely economic impact for the planning example used in this guide. Each one addresses a specific operational pain point that creates measurable monthly leakage. The illustrative figures use the same example company defined in the calculator: 500 monthly shipments, $425,000 monthly revenue, 8% late delivery rate, $12,000 monthly expedite spend, and 4 operations staff at $38 per hour.
Where to Start:
Real-time shipment visibility is the recommended first pilot in this guide because it directly addresses late delivery cost, expedite spend, and manual tracking time simultaneously. It also creates the carrier data foundation that profitability analytics and exception management both depend on.
A note on illustrative figures:
The financial scenarios in each deep dive use the planning assumptions from the calculator above. All figures are before implementation costs, software subscriptions, and internal labor. Actual outcomes depend on your baseline performance, data quality, adoption rate, and operating constraints. Treat them as a starting point for your own calculation, not as projected results.
Deep Dive 1: Real-Time Shipment Visibility and Exception Detection
The Operational Challenge
Operations teams at most regional 3PLs learn about late shipments, carrier delays, and SLA risks from customer calls, not from their own systems. The TMS shows what was booked. The carrier portal shows what is in transit. Neither system is connected to the other in real time, and neither sends an alert when a shipment is trending toward a missed delivery window. By the time the problem is visible, the SLA has already been missed and the expedite cost is already committed.
Where the Money Leaks
Every late delivery has a direct cost: the penalty, the expedite to recover the shipment, the customer credit, and the operations manager time spent on the escalation. In the planning example, 40 shipments per month arrive late (500 × 8%). At $320 per incident, that is $12,800 per month in direct late delivery cost alone, before expedite spend is added. The majority of these incidents are detectable 24 to 48 hours before the delivery window closes, which means the cost is largely preventable with earlier visibility.
Illustrative calculation: 500 shipments × 8% late rate × $320 per incident = $12,800 per month. Annual: $12,800 × 12 = $153,600.
Why It Happens
Carrier tracking data lives in carrier portals, not in your TMS. Each carrier uses different status codes, different update frequencies, and different definitions of in transit versus delayed. Without a data integration layer that normalizes carrier status data and compares it against your SLA thresholds in real time, there is no automated way to flag at-risk shipments. Operations staff check portals manually, which means exceptions are identified on a schedule rather than as they emerge.
What Digital Transformation Changes
A real-time shipment visibility layer connects your TMS shipment records to carrier tracking feeds, normalizes status codes across carriers, and compares current shipment status against SLA deadlines. When a shipment’s last carrier scan puts it at risk of missing its delivery window, an automated alert is generated for the operations team. The team acts on the alert, not on the customer call. Over time, the alert data also reveals which carriers, lanes, and shipment types generate the most exceptions, which informs carrier selection and contract negotiation.
The 3PL Example
A regional 3PL running 500 monthly shipments connects its TMS and top three carriers to a unified shipment visibility dashboard. Automated alerts fire for any shipment where the carrier’s last scan puts delivery at risk within 48 hours. In the first 30 days, the operations team resolves 12 exceptions before the delivery window closes that would previously have been identified after the fact. Late delivery rate begins to fall. Expedite spend on those 12 shipments is avoided entirely because the resolution options available 48 hours out are significantly cheaper than the options available after a missed window.
Measurable Business Impact
- Late Delivery Cost Reduction: Late delivery costs decrease as at-risk shipments are identified and resolved before the window closes rather than after.
- Expedite Spend Reduction: Expedite spend falls as proactive intervention replaces reactive recovery. Earlier detection means more resolution options at lower cost.
- Operations Staff Time Recaptured: Time spent monitoring carrier portals and responding to customer escalations decreases as automated alerts replace manual checking cycles.
Illustrative scenario: reducing the late delivery rate from 8% to 5% (a 3 percentage-point reduction) would lower monthly late delivery cost from $12,800 to $8,000, a $4,800 monthly improvement. Annual: $4,800 × 12 = $57,600.
Best-Fit Services
Recommended First Pilot (Weeks 1-8)
Connect your TMS and the top three carriers by shipment volume to a single shipment status dashboard. Normalize status codes across those carriers. Build an automated alert for any shipment where the carrier’s last scan puts delivery at risk within the next 48 hours. Run for 30 days across one customer segment or lane. Track: number of alerts generated, number of exceptions resolved before the window closed, and change in late delivery rate for that segment.
Deep Dive 2: Customer and Lane Profitability Analytics
The Operational Challenge
Most 3PLs price by rate card and manage customer relationships by revenue volume. The problem is that revenue volume is not margin contribution. A high-volume customer with complex accessorial requirements, frequent exceptions, and a demanding SLA may be generating significantly less margin per shipment than a smaller customer with straightforward freight and low exception rates. Without a customer-level cost-to-serve model, pricing decisions are made on incomplete information and capacity is allocated to the wrong relationships.
Where the Money Leaks
Margin leakage in this area is structural and largely invisible without the right data. It shows up in three places: lanes priced below their true cost-to-serve because accessorial charges and exception handling costs were not included in the rate model; customer relationships that look profitable on revenue but are not profitable after carrier cost variance, claims, and exception handling are allocated; and capacity allocated to high-volume, low-margin accounts at the expense of smaller accounts with better margin contribution. The leakage is ongoing and compounds with every renewal cycle where pricing decisions are made without cost-to-serve data.
Why It Happens
Cost-to-serve data for a 3PL customer requires joining TMS revenue records, carrier cost invoices, accessorial charge records, exception handling logs, and customer service time. These data sources live in different systems, are often billed on different cycles, and are rarely joined at the customer or lane level. Without a data integration layer that brings them together, the only view available is revenue by customer, which tells you who ships the most but not who generates the most margin.
What Digital Transformation Changes
A customer and lane profitability model joins TMS revenue, carrier cost, accessorial charges, and exception handling cost at the shipment level and rolls it up to the customer and lane level. The output is a ranked view of customers and lanes by true margin contribution, not revenue volume. Account managers can see which relationships are worth growing, which need repricing, and which are generating negative margin after all costs are allocated. Pricing decisions at renewal are grounded in actual cost-to-serve data rather than rate card assumptions.
The 3PL Example
A regional 3PL builds a customer profitability model for its top 20 accounts by revenue. The model reveals that three of the top five accounts by revenue rank in the bottom eight by margin contribution after accessorials, exception handling, and carrier cost variance are allocated. Two of those three accounts are up for renewal in the next 90 days. The account management team enters those renewals with cost-to-serve data rather than rate card history, and the pricing conversation changes.
Measurable Business Impact
- Pricing Accuracy: Lane pricing decisions are informed by actual cost-to-serve data, reducing the risk of underpriced renewals on complex or exception-heavy accounts.
- Capacity Allocation: Operations capacity and carrier relationships are directed toward customers and lanes with the best margin contribution rather than the highest revenue volume.
- Negotiation Leverage: Carrier rate negotiations are supported by lane-level cost and performance data rather than relationship and rate card history alone.
No specific dollar figure is provided here because the impact depends entirely on the gap between your current pricing and your actual cost-to-serve, which varies by customer mix, carrier cost structure, and accessorial exposure. The pilot below is designed to surface that gap.
Best-Fit Services
Recommended First Pilot (Weeks 1-8)
Build a customer profitability model for your top 20 accounts by revenue using TMS revenue records, carrier cost invoices, and exception handling logs. Rank accounts by true margin contribution and identify the top five accounts where the gap between revenue rank and margin rank is largest. Use the output to prepare for the next renewal cycle for those five accounts.
Ready to See Where Your Operation Is Leaking Margin?
We run a free 3PL Operational Leakage Assessment using your actual TMS, carrier, and customer data. You get a clear view of where late delivery costs, expedite spend, and manual tracking overhead are hitting your margin, and a prioritized roadmap for addressing them.
Deep Dive 3: Automated Exception Management and SLA Risk Alerts
The Operational Challenge
Exception management at most 3PLs is manual, reactive, and dependent on individual operations staff monitoring carrier portals and email threads. Exceptions are identified late, escalated to customers after the fact, and resolved without a systematic record of root cause. The result is a pattern of recurring exceptions on the same carriers, lanes, and shipment types that never gets addressed because the data to identify the pattern does not exist in one place.
Where the Money Leaks
The direct cost of manual exception management is the operations staff time consumed by triage, carrier escalation, and customer communication. In the planning example, 4 operations staff each spend 6 hours per week on manual tracking and exception-related work. Monthly manual tracking cost: 4 × 6 × 4.33 × $38 = approximately $3,949 per month. Annual: $3,949 × 12 = approximately $47,400. The indirect cost is the SLA performance impact of late detection: exceptions identified after the window has closed require more expensive resolution and generate more customer relationship damage than exceptions identified while there is still time to intervene.
Why It Happens
Automated exception detection requires a normalized, real-time view of shipment status across all carriers compared against SLA thresholds. Without a data integration layer that connects carrier tracking feeds to your TMS shipment records and SLA commitments, there is no automated way to generate an alert. The default is manual monitoring, which is slower, less consistent, and dependent on individual staff availability.
What Digital Transformation Changes
An automated exception detection layer monitors shipment status against SLA thresholds in real time and generates alerts for at-risk shipments before the delivery window closes. Operations staff shift from monitoring carrier portals to acting on alerts. Customer updates for at-risk shipments are triggered by data rather than by a staff member checking a screen. Root cause data is captured for every exception, enabling pattern analysis by carrier, lane, and shipment type. Over time, the exception data informs carrier selection decisions and contract negotiations.
The 3PL Example
A regional 3PL implements automated exception detection across its top three carriers. In the first 60 days, the operations team identifies that one carrier accounts for 60% of all SLA risk alerts on a specific lane. The data supports a carrier performance conversation that results in a service improvement commitment. The exception rate on that lane falls in the following quarter. The operations team did not have the data to have that conversation before the alert layer was in place.
Measurable Business Impact
- Manual Tracking Time Reduced: Operations staff time spent on routine carrier portal monitoring and status updates decreases as automated alerts replace manual checking cycles.
- Earlier Exception Detection: The gap between when an exception becomes detectable and when the operations team acts on it narrows, increasing the proportion of exceptions resolved before the SLA window closes.
- Exception Pattern Visibility: Root cause data accumulates over time, enabling carrier and lane decisions to be informed by exception frequency rather than relationship history.
Illustrative scenario: if automation reduces manual tracking time by 60%, monthly tracking cost falls from approximately $3,950 to approximately $1,580, saving about $2,370 per month. Annual: about $28,400.
Best-Fit Services
Recommended First Pilot (Weeks 1-8)
Build an automated exception detection layer that monitors shipment status against SLA thresholds for one customer segment or service line. Generate alerts for any shipment where the carrier’s last scan puts delivery at risk within 48 hours. Track: number of alerts generated per week, proportion of exceptions resolved before the window closed versus after, and change in weekly manual tracking hours for the operations staff covering that segment.
Deep Dive 4: Carrier Performance Scorecards and Cost Benchmarking
The Operational Challenge
Carrier selection and negotiation decisions at most 3PLs are made on rate and relationship rather than performance data. On-time delivery rates, damage rates, and cost variances by carrier, lane, and shipment type are not tracked systematically. Underperforming carriers are retained because the performance data to justify a change does not exist in a usable form. Cost benchmarking happens at contract renewal rather than continuously, which means pricing leverage is only applied once every one to three years.
Where the Money Leaks
Carrier cost leakage shows up in three places: higher carrier costs on lanes where a better-performing alternative exists but has not been identified; SLA exposure from underperforming carriers that generate a disproportionate share of late deliveries and exceptions; and damage and claim costs that are not attributed to carrier performance in a way that informs selection decisions. The combined impact is ongoing and grows with volume.
Why It Happens
Carrier performance data is scattered across TMS records, carrier invoices, claims logs, and exception tracking spreadsheets. Joining these sources at the carrier and lane level requires a data integration step that most 3PLs have not built. Without it, performance evaluation is qualitative and relationship-based rather than data-driven.
What Digital Transformation Changes
A carrier performance scorecard joins TMS shipment records, carrier cost invoices, on-time delivery data, damage and claims logs, and exception frequency at the carrier and lane level. The output is a ranked view of carrier performance by on-time delivery rate, cost per shipment by lane, damage rate, and exception frequency. Carrier selection decisions are informed by the scorecard. Contract negotiations are supported by lane-level cost and performance data. Underperforming carriers are identified and addressed on a continuous basis rather than at renewal.
The 3PL Example
A regional 3PL builds carrier scorecards for its top 10 carriers by shipment volume. The scorecard reveals that the carrier handling the highest volume on its Northeast lane has an on-time delivery rate 6 percentage points below the next best alternative on that lane, at a cost per shipment that is $18 higher. The operations director uses the scorecard in the next carrier review meeting. The conversation shifts from relationship management to performance management.
Measurable Business Impact
- Expedite Spend Reduction: Expedite spend decreases as underperforming carriers on high-exception lanes are replaced or renegotiated based on scorecard data.
- Carrier Cost Improvement: Lane-level cost benchmarking informs negotiation and carrier selection, reducing cost per shipment on lanes where better alternatives exist.
- SLA Performance Improvement: Carrier selection decisions informed by on-time delivery rates reduce the proportion of shipments handled by carriers with high exception rates.
Illustrative scenario: if carrier scorecards enable a 15% reduction in monthly expedite spend, monthly expedite cost falls from $12,000 to $10,200, a saving of $1,800 per month. Annual: $1,800 × 12 = $21,600.
Best-Fit Services
Recommended First Pilot (Weeks 1-8)
Build a carrier scorecard for your top 10 carriers by shipment volume covering on-time delivery rate, cost per shipment by lane, damage rate, and exception frequency. Run for 60 days. Use the output to rank carriers by performance on your highest-volume lanes and prepare a data-backed brief for the next carrier rate negotiation.
Deep Dive 5: Operations Reporting Automation and Executive Visibility
The Operational Challenge
Weekly and monthly operations reports at most 3PLs are compiled manually from TMS, WMS, and carrier portal exports by operations staff. The process takes several hours per week per staff member. Reports arrive too late to drive operational decisions. Data is inconsistent across reporting periods because it is assembled by hand from sources that do not share a common data model. Leadership makes decisions on information that is already several days old.
Where the Money Leaks
The direct cost is operations staff time. In the planning example, assume 10 hours per week are spent on reporting-related work. Monthly reporting labor cost: 10 × 4.33 × $38 = approximately $1,645 per month. Annual: approximately $19,700. The indirect cost is the decisions made on stale data: carrier issues that persist for weeks before they appear in a report, customer profitability trends that are invisible until the annual review, and SLA performance patterns that are identified too late to address before a contract renewal.
Why It Happens
Automated reporting requires a consistent, joined data model across TMS, WMS, and carrier data sources. Without a data integration layer and a defined set of KPIs agreed across the operations team, every report is a manual assembly job. Different staff members pull data differently, apply different filters, and produce reports that cannot be compared across periods. The inconsistency is not a people problem. It is a data architecture problem.
What Digital Transformation Changes
Automated operations reporting connects TMS, WMS, and carrier data to a live dashboard that updates on a defined schedule. The weekly operations report is generated automatically. KPIs are defined, agreed, and calculated consistently across every reporting period. Leadership has a real-time view of shipment performance, SLA compliance, carrier cost, and exception trends without waiting for a staff member to compile the data. Operations staff shift from report production to report interpretation and action.
The 3PL Example
A regional 3PL automates its weekly operations report for one customer segment. The report that previously took 2.5 hours to compile is now available automatically every Monday morning. The operations director uses the first three automated reports to identify a carrier cost variance on a specific lane that had been invisible in the manual reporting process. The variance had been running for at least two months. Whether the avoided cost exceeds the cost of automation depends on shipment volume, cost variance per shipment, and the actual build and support cost of the reporting layer.
Measurable Business Impact
- Reporting Time Reduced: Weekly reporting hours decrease as automated pipelines replace manual data assembly, freeing operations staff for exception management and customer communication.
- Reporting Consistency Improved: KPIs are calculated from the same data model in every reporting period, eliminating the discrepancies that arise from manual assembly.
- Decision Speed Improved: Leadership has access to current operational data rather than data that is several days old, enabling faster responses to emerging carrier, customer, or SLA issues.
Illustrative scenario: automating reporting-related work reduces reporting time from 10 hours per week to 2 hours per week, an 8-hour weekly reduction. Monthly saving: 8 × 4.33 × $38 = approximately $1,316 per month. Annual: approximately $15,800.
Best-Fit Services
Recommended First Pilot (Weeks 1-8)
Automate the weekly operations report for one customer segment or service line by connecting TMS and carrier data to a live dashboard with agreed KPIs. Track: weekly reporting hours before and after, number of manual data pulls eliminated, and time from data cutoff to report availability. Use the pilot to define the KPI framework for the full operations reporting rollout.
The Business Case: Benefits and Tradeoffs of Digital Transformatio
The five use cases above represent the highest-impact areas for a regional 3PL. Before committing to a program, it helps to be clear about what you are buying, what it costs, and what the realistic range of outcomes looks like.
What You Are Buying
You are not buying software. You are buying operational leverage: the ability to detect problems earlier, make pricing decisions on better data, and reclaim operations staff time from manual work that should be automated. The economic case rests on four projected outcomes, each of which should be validated against your own baseline before implementation begins:
- Late delivery cost reduction as at-risk shipments are identified and resolved before the SLA window closes rather than after. Projected target: a measurable reduction in late delivery rate over the first 90 days of the visibility pilot.
- Expedite spend reduction as proactive intervention replaces reactive recovery and carrier scorecards inform selection decisions. Projected target: a reduction in monthly expedite spend as the carrier scorecard pilot matures.
- Operations staff time recaptured from manual tracking and reporting. Projected target: a reduction in weekly manual tracking and reporting hours within 60 days of automation going live.
- Customer and lane profitability visibility that enables pricing and capacity decisions to be made on cost-to-serve data rather than rate card assumptions. Projected target: pricing decisions informed by actual cost-to-serve data by the end of the customer profitability pilot.
If you cannot tie a proposed project to a reduction in late delivery cost, expedite spend, manual labor cost, or a pricing decision that improves margin contribution, the project is not ready to fund. Start with the use case where the financial leakage is largest and most measurable. Everything else can follow.
What Transformation Really Costs
The cost categories below are common for SMB and low mid-market 3PL engagements. They are not quotes. Actual investment depends on system complexity, number of integrations, data quality, reporting scope, and support needs.
- Data integration across TMS, WMS, ERP, and carrier portals: This is typically the largest cost item and the most underestimated. Carrier data feeds vary in quality, update frequency, and status code consistency. Budget for data normalization work, not just connector setup.
- Shipment visibility dashboard and exception alert layer: The build cost depends on the number of carriers, the complexity of your SLA rules, and whether you are using an existing BI platform or building from scratch.
- Customer and lane profitability model: Requires joining TMS revenue, carrier cost invoices, and accessorial records at the shipment level. The data preparation work is typically more time-consuming than the model build.
- Ongoing data engineering and platform support: Carrier data feeds change. TMS versions update. Budget for ongoing maintenance, not just the initial build.
- Internal adoption and process change: The operations team needs to shift from monitoring carrier portals to acting on alerts. This is a behavior change, not a technology change. Budget for training and a change management period.
CAPEX vs. OPEX:
Most SMB 3PL transformation programs are structured as managed services or phased project engagements rather than large capital investments. This keeps the initial commitment manageable and allows scope to expand as pilots prove value. If a vendor or partner is asking for a large upfront commitment before any pilot has been run, that is a risk signal.
Pro Tip:
Start with carrier data standardization before building dashboards. If your carrier status codes are inconsistent, your on-time delivery calculations will be wrong, your exception alerts will fire on bad data, and your scorecard will rank carriers incorrectly. Two weeks spent standardizing carrier status codes across your top five carriers will save months of debugging downstream.
Common Challenges 3PLs Face When Starting a Transformation Program
The use cases above are straightforward in principle. In practice, most 3PL transformation programs encounter the same set of obstacles. Knowing them in advance reduces the risk of stalling after the first pilot.
Inconsistent Carrier Status Codes Across Carriers
Every carrier uses different status codes, different update frequencies, and different definitions of key events like picked up, in transit, and out for delivery. Without a normalization layer, your shipment visibility dashboard will show incomparable data across carriers, and your exception alerts will fire incorrectly.
Prevention: Map carrier status codes to a standard internal taxonomy before building any dashboard or alert layer. This is a one-time data preparation step that pays dividends across every downstream use case.
TMS Shipment Records That Do Not Match Billing Records
In many 3PL operations, the shipment record in the TMS does not match the billing record in the ERP because accessorial charges, adjustments, and carrier invoice corrections are applied after the fact in a separate system. A customer profitability model built on TMS revenue data alone will overstate margin on accounts with high accessorial exposure.
Prevention: Include ERP billing data and carrier invoice data in the profitability model from the start. Do not build a cost-to-serve model on TMS revenue data alone.
Operations Staff Resistance to Alert-Driven Exception Management
Operations staff who have built their workflow around monitoring carrier portals and managing exceptions manually may resist a shift to alert-driven exception management. The resistance is usually not about the technology. It is about trust: staff need to trust that the alerts are accurate before they stop checking portals manually.
Prevention: Run the alert system in parallel with manual monitoring for the first 30 days. Track alert accuracy. Show staff the data. Trust builds when alerts prove reliable.
Profitability Models That Exclude Accessorial Charges and Exception Handling Costs
The most common mistake in 3PL profitability modeling is building a model that allocates carrier line-haul cost but excludes accessorials, fuel surcharges, residential delivery fees, and exception handling labor. The result is a model that understates the cost-to-serve for complex accounts and overstates margin on high-accessorial customers.
Prevention: Define the full cost-to-serve allocation before building the model. Include carrier line-haul, accessorials, fuel surcharges, claims, and an allocation of exception handling labor. Review the allocation methodology with your finance team before publishing results.
Building Dashboards Before Agreeing on KPI Definitions
It is common for 3PL operations teams to disagree on how key metrics are calculated once a dashboard is built and the numbers are visible. On-time delivery rate is a frequent source of disagreement: is it measured at the delivery window, at the appointment time, or at the end of the delivery day? If the definition is not agreed before the dashboard is built, the dashboard will be challenged rather than trusted.
Prevention: Run a KPI definition workshop with operations leadership before building any dashboard. Document the agreed definition, the data source, and the calculation method for each metric. Get sign-off before development starts.
No Baseline Metrics Captured Before the Program Starts
Without a baseline, you cannot demonstrate improvement. If you do not know your current late delivery rate, your current weekly manual tracking hours, or your current monthly expedite spend before the program starts, you will not be able to show the business impact of the changes you make.
Prevention: Spend the first two weeks of any engagement capturing baseline metrics for every KPI the program is designed to improve. Document the measurement method so the post-implementation comparison is valid.
When You See ROI and What to Expect at Each Stage
ROI does not arrive all at once. Early wins come from visibility and exception control. Bigger gains follow as carrier decisions, pricing, and reporting are informed by consistent data. For a regional 3PL, this transformation follows a clear maturity curve:
No operational change yet. Audit your TMS, WMS, ERP, and carrier data sources. Map carrier status codes to a standard taxonomy. Define KPIs with operations leadership. Capture baseline metrics for late delivery rate, expedite spend, and manual tracking hours. The output is a clear picture of where your data is reliable and which use cases are ready to build first.
The visibility dashboard and exception alert layer go live for one customer segment or lane. Automated alerts begin replacing manual carrier portal monitoring. Operations staff start acting on alerts rather than customer calls. Manual tracking hours for the pilot segment begin to fall.
Months 4 to 6: Late Delivery Rate Begins to Fall
As the exception alert layer matures and the team builds trust in the alerts, more at-risk shipments are resolved before the SLA window closes. Late delivery rate starts to decline. The financial impact of earlier detection becomes visible in your monthly late delivery cost.
Carrier performance scorecards go live. The first carrier negotiation supported by scorecard data takes place. Reporting automation reduces weekly reporting hours. Operations staff shift from compiling reports to acting on them.
All five use cases are live. The customer and lane profitability model informs pricing decisions at renewal. Exception rates continue to fall as carrier selection and lane management are informed by scorecard data. The business runs on facts, not instinct.
The Core Pillars of a 3PL Digital Strategy
The five use cases above are not independent projects. They build on each other. Build them in order. Each pillar enables the next.
Pillar 1: Unified Shipment Data Foundation
Connect TMS, WMS, ERP, and carrier tracking data into a single, normalized data layer with consistent shipment status codes, agreed KPI definitions, and a complete record of each shipment from booking to billing. Without this foundation, every downstream use case is built on inconsistent data. This pillar is not visible to customers or leadership, but it is the reason every other pillar works. Key capabilities: carrier status normalization, TMS-to-ERP data reconciliation, agreed data model documentation, and baseline metric capture.
Pillar 2: Real-Time Operational Visibility
Build a live view of shipment status, SLA performance, and exception risk across all carriers and customer segments. Automated alerts replace manual portal monitoring. Operations staff manage by exception rather than by inbox. This pillar is where the first measurable reduction in late delivery cost and manual tracking hours becomes visible. Key capabilities: multi-carrier shipment tracking dashboard, SLA threshold monitoring, automated exception alerts, and exception root cause capture.
Pillar 3: Customer and Lane Profitability Intelligence
Build a cost-to-serve model that allocates carrier cost, accessorial charges, and exception handling at the customer and lane level. Rank customers and lanes by true margin contribution. Use the output to inform pricing decisions, capacity allocation, and carrier selection. This pillar changes how account management and pricing decisions are made. Key capabilities: customer-level cost-to-serve model, lane profitability ranking, renewal pricing support, and capacity allocation analysis.
Pillar 4: Automated Exception and SLA Management
Extend the real-time visibility layer with automated exception detection, SLA risk scoring, and carrier performance tracking. Exceptions are flagged before windows close. Carrier scorecards inform selection and negotiation. Root cause data accumulates over time, enabling structural improvements to carrier mix and lane management. This pillar is where the compounding operational improvement becomes visible. Key capabilities: carrier performance scorecards, automated operations reporting, exception pattern analysis, and carrier negotiation support.
Implementation Roadmap
The roadmap below is designed for a regional 3PL starting from a fragmented data environment. It is a guide, not a guarantee. Actual timelines depend on data complexity, system access, and internal resource availability.
| Phase | Timeframe | Focus | Key Deliverables | Success Metric |
| 1. Baseline | Weeks 1-2 | Data audit and KPI definition | Carrier data map, KPI framework, baseline metrics captured | Baseline late delivery rate, expedite spend, and manual tracking hours documented |
| 2. Data Foundation | Weeks 3-6 | Carrier data normalization and TMS integration | Normalized carrier status codes, TMS-to-carrier data pipeline, agreed data model | Carrier status data consistent across top 5 carriers, TMS records joinable to carrier tracking |
| 3. Visibility Pilot | Weeks 7-10 | Shipment visibility dashboard and exception alerts | Live shipment dashboard for one segment, automated SLA risk alerts | Manual tracking hours reduced for pilot segment, proportion of exceptions detected before window closes |
| 4. Profitability Model | Months 4-5 | Customer and lane profitability analytics | Cost-to-serve model for top 20 accounts, customer profitability ranking | Top 5 accounts with largest revenue-to-margin rank gap identified |
| 5. Carrier Scorecards | Months 6-8 | Carrier performance tracking and reporting automation | Carrier scorecard for top 10 carriers, automated weekly operations report | Reporting hours reduced, first carrier negotiation supported by scorecard data |
| 6. Scale and Optimize | Months 9-12 | Full rollout and continuous improvement | All use cases live across all customer segments and carriers, exception pattern analysis | Late delivery rate trend, expedite spend trend, manual tracking hours trend versus baseline |
Phase 1 Step-by-Step: What to Do in the First Two Weeks
- Audit your carrier data feeds. List every carrier you use. For each carrier, document: how shipment status is delivered (API, portal export, EDI, email), how frequently status updates, and what status codes are used. Identify which carriers have reliable, frequent status updates and which do not.
- Map carrier status codes to a standard taxonomy. Define your internal status taxonomy (for example: Booked, Picked Up, In Transit, At Risk, Delivered, Exception, Returned). Map each carrier’s status codes to your taxonomy. Document the mapping.
- Capture baseline metrics. For the most recent 90 days, calculate: total shipments, late shipments, late delivery rate, total expedite spend, and total manual tracking hours per week across operations staff. These are your baseline figures. Every improvement will be measured against them.
- Define KPIs with operations leadership. Agree on the definition, data source, and calculation method for each KPI before any dashboard is built. Document the agreed definitions. Get sign-off from operations leadership.
- Identify the highest-priority pilot. Based on the baseline metrics, identify which use case has the largest measurable leakage: late delivery cost, expedite spend, or manual tracking hours. That is where the first pilot should focus.
The Most Important Rule in the Roadmap:
The most common reason 3PL transformation programs stall is that the data foundation work takes longer than expected because carrier data quality issues were not identified upfront. Two weeks spent on the baseline audit will save months of rework downstream. Do not skip it.
Conclusion
The leakage in a regional 3PL is not a mystery. It shows up in the same places: late delivery penalties from exceptions detected too late, expedite spend that compounds without real-time visibility, manual tracking hours that should be automated, and pricing decisions made without cost-to-serve data. The numbers are calculable. The causes are fixable.
Start with the use case where your baseline shows the largest leakage. Build the foundation. Prove the value. Then expand. The 3PLs hardest to compete with in three years will not be the ones with the most technology. They will be the ones that can tell a customer exactly where their shipment is, what it costs to serve them, and which carrier will get the job done on time at the best cost.
Ready to Build a 3PL Operation That Runs on Data?
We work with regional 3PLs and logistics providers to connect fragmented operational data, build real-time shipment visibility, and create the customer and lane profitability analytics that make pricing and capacity decisions defensible. Start with a free Operational Leakage Assessment.