
Data quality management can make—or break—your business decisions.
When decisions are based on inaccurate or incomplete data, the consequences are real: misguided strategies, customer dissatisfaction, and financial loss. Gartner estimates that poor data quality costs organizations an average of $12.9 million per year. Moreover, according to Monte Carlo, data engineers spend up to 40% of their time dealing with the fallout from bad data. Managing data quality isn’t optional—it’s a strategic necessity.
So, how can you avoid these costs and ensure you get clean, actionable data for strategic decision-making? This blog is a comprehensive guide on data quality management and the fundamentals that must not be ignored. We also provide actionable steps to help you do it the right way to maximize business value and minimize risks for your organization.
What is Data Quality Management?
Data quality management (DQM) is a comprehensive approach to ensuring that your data meets the highest standards of accuracy, completeness, consistency, timeliness, and integrity. Let’s look into each aspect of DQM, explore common challenges, and understand the solutions that can help you overcome them.
The Many Dimensions of Data Quality
Data quality has many dimensions. Each dimension plays a vital role in ensuring your data serves its purpose effectively. All of them combined ensure that your data is accurate, complete, consistent, timely, and maintains integrity throughout its lifecycle. While maintaining data quality, focus on the following:
1. Accuracy: This refers to the correctness of the information provided. Accurate data correctly represents the real-world construct to which it refers. For example, a customer record in finance with the correct spelling of a name, billing address, and accurate transaction history reflects high accuracy. Inaccurate data like a mistyped email or outdated phone number can lead to failed communications, delivery issues, and mistrust in reporting.
2. Completeness: Completeness means that there are no missing values or datasets. Incomplete data can lead to misinformed decisions and insights. For example, a customer profile without an email address or phone number limits your ability to run effective cold outreach or email campaigns promoting your offers or discounts.
Completeness also applies to structural completeness (i.e. all expected columns or attributes exist) and referential completeness (i.e. every referenced ID or key in one dataset has a corresponding record in another). This is crucial because missing lookup values, empty foreign keys, or incomplete transactions can break relationships between datasets, leading to disjointed customer datasets.
3. Consistency: Consistency involves maintaining uniformity in format and value across various sources. For example, if order and transaction dates are stored in multiple formats (e.g., MM/DD/YYYY vs DD-MM-YYYY), or countries are labeled differently (“UK” vs “United Kingdom”), it can break reporting pipelines and mislead analysis. This makes tracking inventory inefficient and managing multiple online transactions tedious.
4. Timeliness: Timeliness ensures that data is up-to-date and relevant for its intended use. In retail, stale data can lead to inefficient inventory management, causing stockouts of in-demand products or overstock of unwanted items. It can also prevent retailers from capitalizing on market trends to boost sales.
5. Integrity: Integrity refers to maintaining the accuracy and consistency of data over its entire lifecycle. This includes ensuring that data remains unaltered and correct as it moves through different stages of processing and storage.
How To Check For Data Quality
Ensuring your data is of high quality requires various checks and validations throughout the data lifecycle. These data quality checks help identify and rectify issues that could compromise data integrity, accuracy, and usefulness within your data pipelines. Below, we delve into several critical data quality checks and their importance. Here’s how to conduct effective data quality monitoring:
1. Anomaly and Range Checks
Anomaly and range checks are essential for identifying data points that deviate significantly from the norm. These checks help in detecting errors, outliers, or fraudulent activities. Imagine a retail dataset where daily sales figures are recorded. If a day’s sales suddenly spike to ten times the average, it could indicate a data entry error or a special event that needs further investigation.
2. Date Type Checks
A dataset containing dates should have all entries in a consistent date format. If some dates are in ‘DD/MM/YYYY’ and others in ‘MM/DD/YYYY’, it can lead to confusion and processing errors. Additionally, some cloud platforms, such as Google BigQuery and Looker Studio, may not recognize inconsistent date formats, resulting in errors or incorrect data interpretation during data ingestion.
Example: An Issue in Date Format with Google BigQuery
Google BigQuery expects date fields to be in a consistent format for efficient querying and accurate data analysis. If dates are inconsistently formatted, BigQuery may not be able to parse them correctly, leading to failed queries or incorrect results.
For instance, consider the following error message from BigQuery:
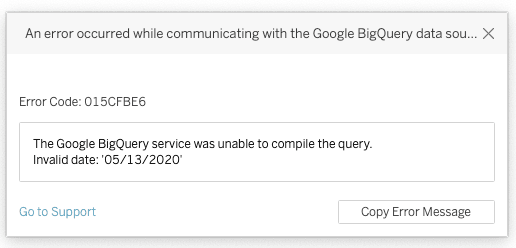
This error occurred because the date ’05/13/2020′ was provided in an invalid format that BigQuery couldn’t compile. In this case, BigQuery expected the date in ‘YYYY-MM-DD’ format but received it in ‘MM/DD/YYYY’ format instead. Such inconsistencies prevent BigQuery from recognizing and processing the date correctly, leading to query failures. Ensuring that all dates are consistently formatted before ingestion can prevent these issues and ensure accurate and reliable data processing and analysis in BigQuery and Looker Studio.
3. Row Count Checks
If a database table is expected to have 1,000 rows, but a query returns only 950, there might be missing records due to data load failures or filtering issues. Within our own projects, we’ve noticed that these row count discrepancies often correspond to deployment issues. For instance, during data pipeline deployments, changes in the ETL process, schema updates, or configuration errors can lead to incomplete data loads or unintended filtering.
These deployment issues can occur due to several reasons:
a) ETL Process Changes: Modifications in the ETL scripts or processes may inadvertently exclude certain rows from being loaded into the database.
b) Schema Updates: Changes in the database schema, such as adding or altering columns, can sometimes lead to partial data loads if the ETL scripts are not updated accordingly.
c) Configuration Errors: Incorrect configurations in the data pipeline, such as path settings or data source connections, can result in incomplete data transfers.
For example, if an ETL process is updated to improve performance or add new features but the script does not account for all necessary rows, some records might be missed during the load. Similarly, if a schema change is implemented without updating the ETL scripts to accommodate the new structure, the data load might fail to include all records. Sometimes, we also get an increase in the number of row counts. This often corresponds to duplicates.
4. Freshness Checks
Freshness checks ensure that the data is up-to-date and relevant for its intended use. Stale data can lead to outdated insights and poor decision-making. A social media dataset should be updated in real-time or at least daily. If the data is a week old, it won’t reflect the traction of your overall content or post.
5. Category Checks
Within data quality, category checks validate that data values fall within predefined categories, ensuring consistency and preventing errors. In a customer dataset, the “Country” field should contain only valid country names. Any entries like “USA,” “United States,” and “US” should be standardized.
Take an example of visualizing data on GA4. In the image, we see a filter for the “Source Medium” with multiple entries related to LinkedIn. The “Source / Medium” dimension can often include inconsistent entries for the same traffic source—such as linkedin, linkedin.com, and LinkedIn. These inconsistencies usually result from non-standardized UTM tagging, leading GA4 to treat each variation as a separate category.
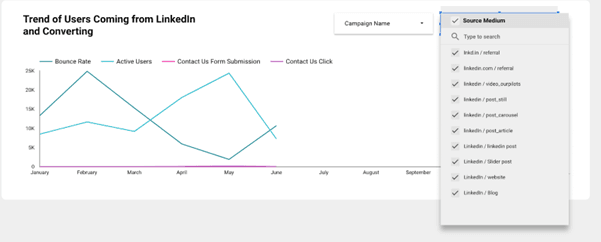
For example, the source should have been consistently named “linkedin” and while the medium could be different (e.g., post, post_article, post_still), these categories should be grouped under a single naming convention such as “post.”
Data Quality Bugs and How to Fix Them
Data quality bugs can cause significant issues if not identified and addressed promptly. If not detected early, these bugs can introduce incorrect values, schema mismatches, broken joins, or duplicated records causing downstream systems to misbehave or deliver flawed insights. That’s why proactive detection and resolution are essential across both development and production stages.
Here’s how you can catch and manage them:
1. Conduct Unit Tests During Development
Test individual components of your ETL pipelines to ensure they function correctly. Writing effective unit tests for data engineering processes involves clearly defining the scope of each unit of data logic or transformation to be tested. This can include single SQL queries, Python functions for data manipulation, or discrete components of a data pipeline. For example, in a social media dataset, you could write tests to ensure the maximum and minimum dates extracted match those shown in the UI. Additionally, you might verify that transformations such as filtering, aggregations, and data type conversions produce the expected results.
Examples of good unit tests include validating expected outputs from specific inputs, checking for boundary conditions (e.g., nulls, empty strings, unusual values), and verifying transformations such as filters, type casts, aggregations, and joins. Another test that helps is unit tests, which help localize bugs at the smallest possible level, making fixes faster and easier.
2. Integration Testing Checks
Before using data in reports or dashboards, we need to make sure all systems are working together correctly e.g. making sure a file uploaded to cloud storage appears properly in a dashboard. We do this by checking three things. Firstly, it is essential to check that the data flows through every step without breaking. Moreover, you must ensure that all your distinct datasets connect properly, like matching customer names to their transactions or purchases. Finally, check that the format and structure of the data stay consistent throughout your dataset. This ensures that the final output is complete, accurate, and trustworthy.
3. Use The Write-Audit-Publish (WAP) Pattern During Production
One of the most effective approaches in production is the Write-Audit-Publish (WAP) Pattern. It consists of 3 major components:
a) Write: Ingest new or updated data into a staging area or temporary table
b) Audit: Run data quality checks (row counts, null checks, business logic validations) before the data is allowed to proceed
c) Publish: If all checks pass, move the data into the production table or make it available to downstream systems
WAP reduces the risk of corrupting your production environment with bad or incomplete data and allows for rollback or quarantine mechanisms when errors are found.
The Bottom Line
Your project’s technical decisions are only as strong as the data they rely on. Data quality management is a core business function. Whether it’s standardizing categories, writing unit tests, or applying patterns like Write-Audit-Publish, ensuring data quality must become a strategic priority. By actively managing the five key dimensions – accuracy, completeness, consistency, timeliness, and integrity – teams can prevent costly errors, improve confidence in analytics, and drive smarter, faster decisions.
In the end, investing in data quality isn’t just about avoiding problems. It’s about creating a foundation for real growth, operational agility, and competitive advantage. Partnering with data management companies can make it easier for you to achieve this as they leverage the right tools, technologies, and frameworks to ensure you have a robust data pipeline that delivers clean, actionable data for your next revenue-building strategy.
If your data quality management needs a revamp and you’re looking for a strategic partner that can help make it easier for you, fill out the form below and let’s connect.