
What if you could see revenue risk before it shows up in your quarterly numbers?
The most powerful customer analytics use cases don’t sit in dashboards, but they shape capital allocation, retention strategy, pricing, and long-term growth.
At the executive level, customer analytics turns behavior into predictive intelligence that protects margin and increases lifetime value. It replaces reactive decisions with future visibility.
This guide breaks down the customer analytics use cases that matter most to the C-suite and how leading companies turn them into measurable enterprise impact.
What Are Customer Analytics?
Customer analytics refers to the systematic use of customer data to understand patterns in behavior, preferences, and interactions across the customer lifecycle: the different stages that a customer goes through during its interaction with a company.
It answers questions like the following:
- What behaviors lead to conversion?
- Why do customers churn?
- Which channels drive the highest lifetime value?
- What actions should we take next?
For the C-suite, information that is important includes:
- Where is next quarter’s revenue at risk?
- Which customers are actually worth scaling?
- Which customers drive profit, not just revenue?
- Where should we invest to increase retention?
- How sensitive are our customers to price changes?
Instead of looking at isolated metrics (like traffic or revenue), customer analytics connects data across touchpoints to provide a complete picture of the customer journey, transforming raw data into strategic insight.
Why Customer Analytics Matter More Than Ever
Modern customers don’t experience your company in departments.
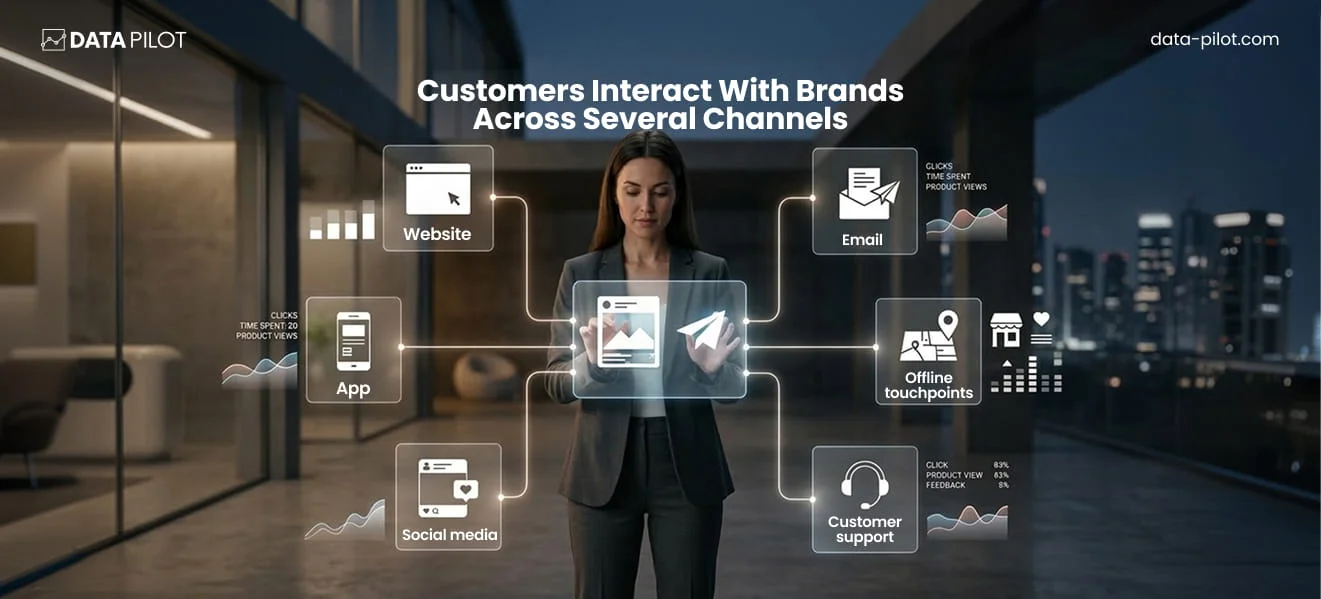
They move fluidly across your website, mobile app, social media, paid ads, email campaigns, offline touchpoints, and customer support and that too often within the same buying journey.
But internally? That story is fragmented.
- Marketing sees campaign metrics.
- Sales sees pipeline velocity.
- Product sees feature usage.
- Support sees tickets.
No one sees the full customer narrative.
Without customer analytics, this data lives in silos and executives make decisions based on partial truths. A spike in churn might look like a pricing issue.
In reality, it could be declining product adoption in a specific segment. Marketing may increase spend to drive new leads while high-value customers quietly disengage due to unresolved support friction.
Customer analytics eliminates that fragmentation. It connects behavioral, transactional, operational, and engagement data into a unified view of how customers move: from awareness to evaluation to purchase to expansion or exit.
And that unified visibility changes decision-making at the top.
Instead of asking, “How did last quarter perform?”
You start asking, “Where is next quarter at risk?”
Instead of increasing marketing budget across the board, you identify which channels attract high-lifetime-value customers versus discount-dependent churners.
Instead of reacting to declining renewals, you see early signals: reduced logins, lower feature adoption, and increased support tickets, weeks or months before revenue is impacted.
That clarity enables:
- Smarter marketing spend focused on high-value segments
- Higher conversion rates through data-driven targeting
- Better personalization across the entire journey
- Stronger retention through early risk detection
- Increased lifetime value through expansion prediction
In short, customer analytics does more than improve reporting.
It aligns the organization around a single source of truth and turns fragmented activity into coordinated growth. In today’s environment is the difference between reactive leadership and controlled, predictable performance.
The Four Types of Customer Analytics
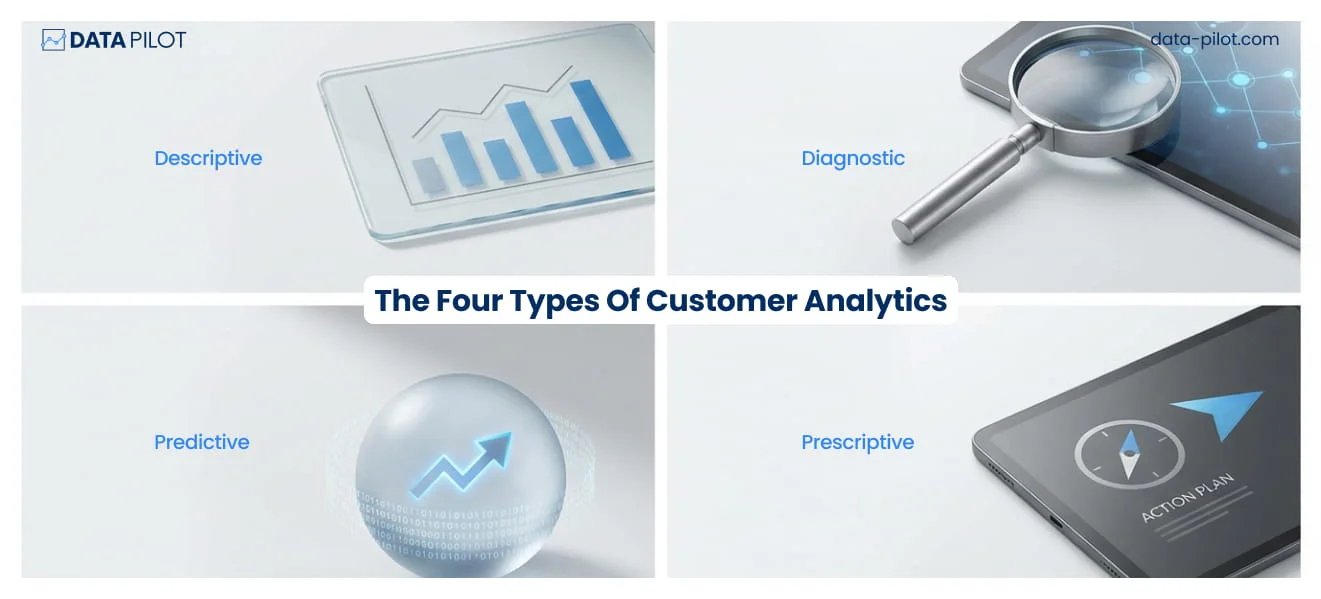
To understand customer analytics fully, you need to understand its four core categories.
1. Descriptive Analytics – What Happened?
Descriptive analytics is the foundation of all customer analytics use cases.
At its core, descriptive analytics answers a simple but critical question: What happened?
It aggregates historical customer data across channels: transactions, engagement activity, support interactions, campaign performance, and turns it into structured insights. For the C-suite, this doesn’t constitute vanity metrics, but it’s more about operational clarity.
Descriptive customer analytics enables executives to see:
- Revenue by customer segment
- Churn rates by cohort
- Customer acquisition cost by channel
- Average order value trends
- Product adoption rates
- Support volume patterns
For example:
- If churn increased last quarter, descriptive analytics identifies which segments drove that increase.
- If marketing spend rose but revenue did not, it highlights which channels underperformed.
- If margins declined, it can expose discount dependency within specific customer groups.
This level of visibility creates a shared source of truth across departments.
Instead of marketing, sales, product, and finance presenting disconnected performance narratives, leadership operates from aligned, verified data. However, descriptive analytics is retrospective. It explains past performance but does not predict future behavior.
Without an accurate understanding of historical patterns, forecasting models and predictive systems are built on unstable ground. In other words, you cannot anticipate churn, optimize lifetime value, or refine pricing strategy without first knowing precisely how your customer base has behaved.
For executive teams, descriptive analytics is the diagnostic layer. It reveals what is working, what is underperforming, and where further investigation is required.
It does not drive strategy alone, but it informs every strategic decision that follows.
Key Descriptive Customer Analytics Use Cases for the C-Suite
- Revenue and Segment Reporting
Track revenue performance across customer segments, regions, and channels. Example: Identify which customer segments contributed most to last quarter’s growth.
- Churn and Retention Analysis
Measure churn rates and retention trends over time. Example: Recognize that first-year customers are leaving faster than expected, prompting early intervention.
- Acquisition Channel Performance
Compare conversion rates and ROI across paid, organic, and referral channels. Example: Marketing discovers email campaigns outperform social campaigns for high-LTV customers.
- Product Adoption and Usage Metrics
Monitor how customers interact with your product or service. Example: A SaaS company sees declining engagement on a core feature, flagging a potential churn risk.
- Support and Customer Service ReportingSummarize tickets, response times, and resolution success. Example: Support analytics reveal certain segments experience repeated issues, which may impact retention.
2. Diagnostic Analytics – Why Did It Happen?
If descriptive analytics answers “What happened?”, diagnostic analytics answers the more strategic question: Why did it happen?
For the C-suite, this distinction is critical.
Revenue doesn’t decline randomly. Churn doesn’t spike without a trigger. Conversion rates don’t fall in isolation. Diagnostic analytics identifies the underlying drivers behind these shifts — across customer behavior, product usage, pricing sensitivity, service interactions, and channel performance.
Instead of stopping at “Churn increased by 3%,” diagnostic analytics reveals:
- Which customer segments drove the increase
- What behaviors preceded cancellation (e.g., reduced logins, lower feature adoption, increased support tickets)
- Whether pricing, onboarding friction, or competitive pressure played a role
- How acquisition channel impacts long-term retention
For example:
A company may discover that customers acquired through aggressive discount campaigns churn 2x faster than full-price customers. On the surface, acquisition volume looked strong. In reality, lifetime value was eroding.
Or consider declining expansion revenue. Diagnostic analysis might reveal that customers who fail to adopt a core feature within the first 30 days rarely upgrade later. That insight shifts investment toward onboarding optimization rather than additional sales headcount.
This is where customer analytics use cases begin influencing capital allocation.
According to a 2026 customer analytics market forecast report from Research and Markets, the global customer analytics market is projected to grow from $13.93 billion in 2025 to $16.7 billion in 2026 at a ~20 % CAGR, driven by the need for businesses to analyze customer data for strategic decision‑making and competitive advantage.
Diagnostic analytics enables leadership teams to:
- Identify the true drivers of churn and retention
- Detect margin erosion at the segment level
- Understand which acquisition channels create durable value
- Align product, marketing, and sales around behavioral realities
At the executive level, this is not a reporting function. It is a risk mitigation and growth acceleration tool.
Because when you understand why performance shifts, you can correct course before financial impact compounds.
Key Diagnostic Customer Analytics Use Cases for the C-Suite
- Churn Root Cause Analysis
Understand the drivers of customer attrition. Example: Customers acquired via heavy discount campaigns are churning 2x faster than full-price customers.
- Sales Performance Drivers
Identify factors influencing pipeline conversion. Example: Deals in a specific region are stalling due to slow product onboarding or delayed demos.
- Marketing ROI Analysis
Determine why certain campaigns over- or under-performed. Example: Paid social campaigns attracted volume but low-value customers, while organic search drove high-LTV acquisitions.
- Customer Support Impact on Retention
Connect support activity with customer satisfaction and retention. Example: Accounts with repeated unresolved support tickets have a 30% higher churn probability.
- Segment-Level Margin AnalysisReveal which customer segments are profitable vs. cost-intensive. Example: High-volume, low-margin segments may be driving top-line growth but eroding overall profitability.
3. Predictive Analytics – What Will Happen?
If descriptive analytics tells you what happened and diagnostic analytics tells you why it happened, predictive analytics answers the question every executive wants to know: What will happen next?
Predictive analytics uses historical customer data, behavioral patterns, and machine learning models to forecast future outcomes. At the C-suite level, it transforms reactive management into proactive strategy.
Key Predictive Customer Analytics Use Cases for the C-Suite
- Churn Prediction
Identify which high-value customers are at risk of leaving before they cancel. This enables targeted retention strategies that protect revenue and maximize lifetime value.
- Upsell and Cross-Sell Forecasting
Predict which customers are most likely to expand or adopt additional products, allowing the sales team to prioritize opportunities with the highest ROI.
- Customer Lifetime Value (CLV) Forecasting
Estimate which new and existing customers will deliver the most value over time, guiding marketing spend, pricing strategy, and account prioritization.
- Demand and Engagement ForecastingAnticipate product usage trends, seasonal spikes, or declining engagement to optimize inventory, staffing, and campaign timing.
4. Prescriptive Analytics – What Should We Do?
If descriptive analytics answers “What happened?”, and diagnostic analytics answers “Why it happened?”, prescriptive analytics answers the most critical question for executives: “What should we do?”
Prescriptive analytics goes beyond forecasting. It combines historical data, predictive insights, and advanced algorithms to recommend concrete actions that optimize outcomes.
For the C-suite, it is the bridge between insight and execution, reducing guesswork and increasing the probability of achieving business goals.
Key Prescriptive Customer Analytics Use Cases for the C-Suite
- Targeted Retention Strategies
Objective: Reduce churn proactively.
How it works: Using predictive churn models, prescriptive analytics recommends tailored retention actions for at-risk high-value customers, such as targeted offers, proactive support, or onboarding interventions.
Example: A subscription SaaS company automatically triggers a personalized onboarding campaign for new customers showing low engagement signals, reducing first-year churn by 20%. - Optimized Marketing Spend
Objective: Maximize ROI across channels.
How it works: Analytics not only shows which channels perform best but also prescribes budget allocation, timing, and content strategy to target high-LTV segments.
Example: An e-commerce brand shifts spend from broad social campaigns to precision email targeting, increasing revenue per campaign by 35%. - Dynamic Pricing and Offers
Objective: Protect margins while driving sales.
How it works: Prescriptive analytics models price elasticity and customer sensitivity to recommend the optimal price point or discount strategy for each segment.
Example: A SaaS company adjusts renewal pricing for different segments based on predicted churn risk and LTV, boosting net revenue retention above 110%. - Product and Feature Recommendations
Objective: Increase adoption and expansion revenue.
How it works: Leveraging customer usage patterns, prescriptive analytics suggests which features or products to upsell, cross-sell, or bundle for maximum impact.
Example: A fintech platform identifies users who frequently access budgeting tools but haven’t adopted premium analytics, triggering a targeted cross-sell campaign. - Resource Allocation for Customer Success
Objective: Optimize internal operations for maximum impact.
How it works: Predictive signals indicate which accounts require additional support, while prescriptive guidance prioritizes interventions based on potential revenue impact.
Example: Customer success teams are guided to focus on accounts likely to expand, rather than spreading efforts evenly, increasing expansion revenue by 25%. - Strategic Experimentation
Objective: Test initiatives with measurable ROI.
How it works: Prescriptive analytics recommends experiments — such as new pricing, product bundles, or retention campaigns — and predicts which are likely to succeed based on historical behavior.
Example: A retailer launches a small-scale offer to a predicted high-response segment before rolling it out broadly, reducing risk while maximizing conversion.
What Data Is Used in Customer Analytics?
Customer analytics relies on diverse data sources to provide a full picture of customer behavior, preferences, and value. For executives, understanding the types of data involved is critical — because the quality, completeness, and integration of data directly determine the effectiveness of analytics and the decisions that follow.
| Data Type | What It Is | C-Suite Use Case / Benefit | Example |
| Transactional Data | Purchase history, subscriptions, renewals, order frequency, payments | Calculate revenue, customer lifetime value, and churn risk | Retail brand segments customers into high-value repeat buyers vs low-frequency shoppers |
| Behavioral Data | Website clicks, app interactions, feature usage, engagement patterns | Predict churn, adoption, and expansion potential | SaaS tracks feature adoption to identify accounts at risk of disengagement |
| Demographic / Firmographic Data | Age, gender, location, income (B2C); company size, industry, revenue (B2B) | Target high-value segments, personalize offers | B2B platform focuses sales on mid-market companies in high-potential industries |
| Customer Feedback / Sentiment Data | Surveys, NPS, reviews, support tickets, social media sentiment | Identify satisfaction issues and churn triggers | Subscription service links slow support responses to early cancellations |
| Marketing & Campaign Data | Email opens, clicks, social engagement, campaign attribution | Optimize acquisition and retention ROI | E-commerce brand measures campaigns by high-LTV purchases, not just volume |
| Operational / Product Data | Service usage logs, delivery times, returns, feature adoption | Connect product/service quality to revenue and retention | SaaS identifies customers who skip onboarding webinars have 30% higher churn |
Key Metrics in Customer Analytics
While every business tracks different KPIs, some of the most important customer analytics metrics include:
- Customer Acquisition Cost (CAC)
- Customer Lifetime Value (LTV)
- Churn Rate
- Retention Rate
- Average Order Value (AOV)
- Conversion Rate
- Engagement Rate
- Cohort Performance
- Net Revenue Retention (NRR)
The real power isn’t tracking these individually.
It’s understanding how they influence each other.
For example:
If CAC is rising but LTV is flat, profitability shrinks.
If engagement improves, retention often follows.
If retention improves, lifetime value increases.
Customer analytics connects these dots.
Common Challenges in Customer Analytics
1. Data Silos
Customer data is scattered across CRMs, marketing automation platforms, product analytics tools, and support systems. When these systems are not integrated, teams only see pieces of the customer journey. Marketing looks at campaigns. Sales looks at pipeline. Product looks at usage. No one has a complete, connected view.
2. Manual Reporting
Instead of analyzing trends and extracting insights, teams spend hours pulling numbers into spreadsheets and building reports. Analytics becomes a backward-looking exercise rather than a forward-looking advantage. By the time the data is compiled, the opportunity to act on it may already be gone.
3. Poor Data Quality
Inconsistent tracking, duplicate records, missing fields, and incorrectly configured events undermine confidence in the data. When teams cannot trust the numbers, they hesitate to use them. That hesitation slows decision-making and weakens the overall impact of analytics.
4. Lack of Attribution Clarity
Connecting marketing touchpoints to revenue remains one of the biggest challenges. Without clear attribution, it is difficult to determine which campaigns, channels, or content efforts are actually driving growth. Budget allocation then becomes more reactive than strategic.
5. No Single Source of Truth
Different departments often operate from different dashboards and definitions. What qualifies as a lead in marketing may not match what sales considers qualified. Revenue numbers may vary across reports. Without shared definitions and aligned data, collaboration suffers.
These challenges limit the true impact of customer analytics. Solving them requires more than better dashboards. It requires the right infrastructure, clear governance, and cross-functional alignment.
Also Read: Levels of Data Maturity: A Complete 1 to 5 Guide for Leaders Who Need ROI
Data Pilot Mini Case Study:
Data Pilot has helped several organizations streamline their reporting and make better, more accurate decisions with real-time customer analytics. Many of these organizations lacked a complete data infrastructure, while for some of them, the issue was not a lack of dashboards.
It was that every dashboard told a different story.
Marketing’s numbers did not match sales. Finance had its own revenue view. Product data refreshed on a different cadence entirely. By the time reports were compiled and reconciled, the data was already outdated. Leadership meetings kept circling the same frustrating question: which numbers are we supposed to trust?
Data Pilot went straight to the source. They rebuilt fragile ETL pipelines, streamlined how data moved between systems, and consolidated everything into a single, reliable source of truth.
The result was not just cleaner reporting. It was real-time customer analytics dashboards that reflected what was happening now, not last week. Once the data was unified and flowing properly, teams stopped second-guessing the numbers. They could see acquisition, engagement, and revenue as it happened and make decisions with confidence instead of delay.
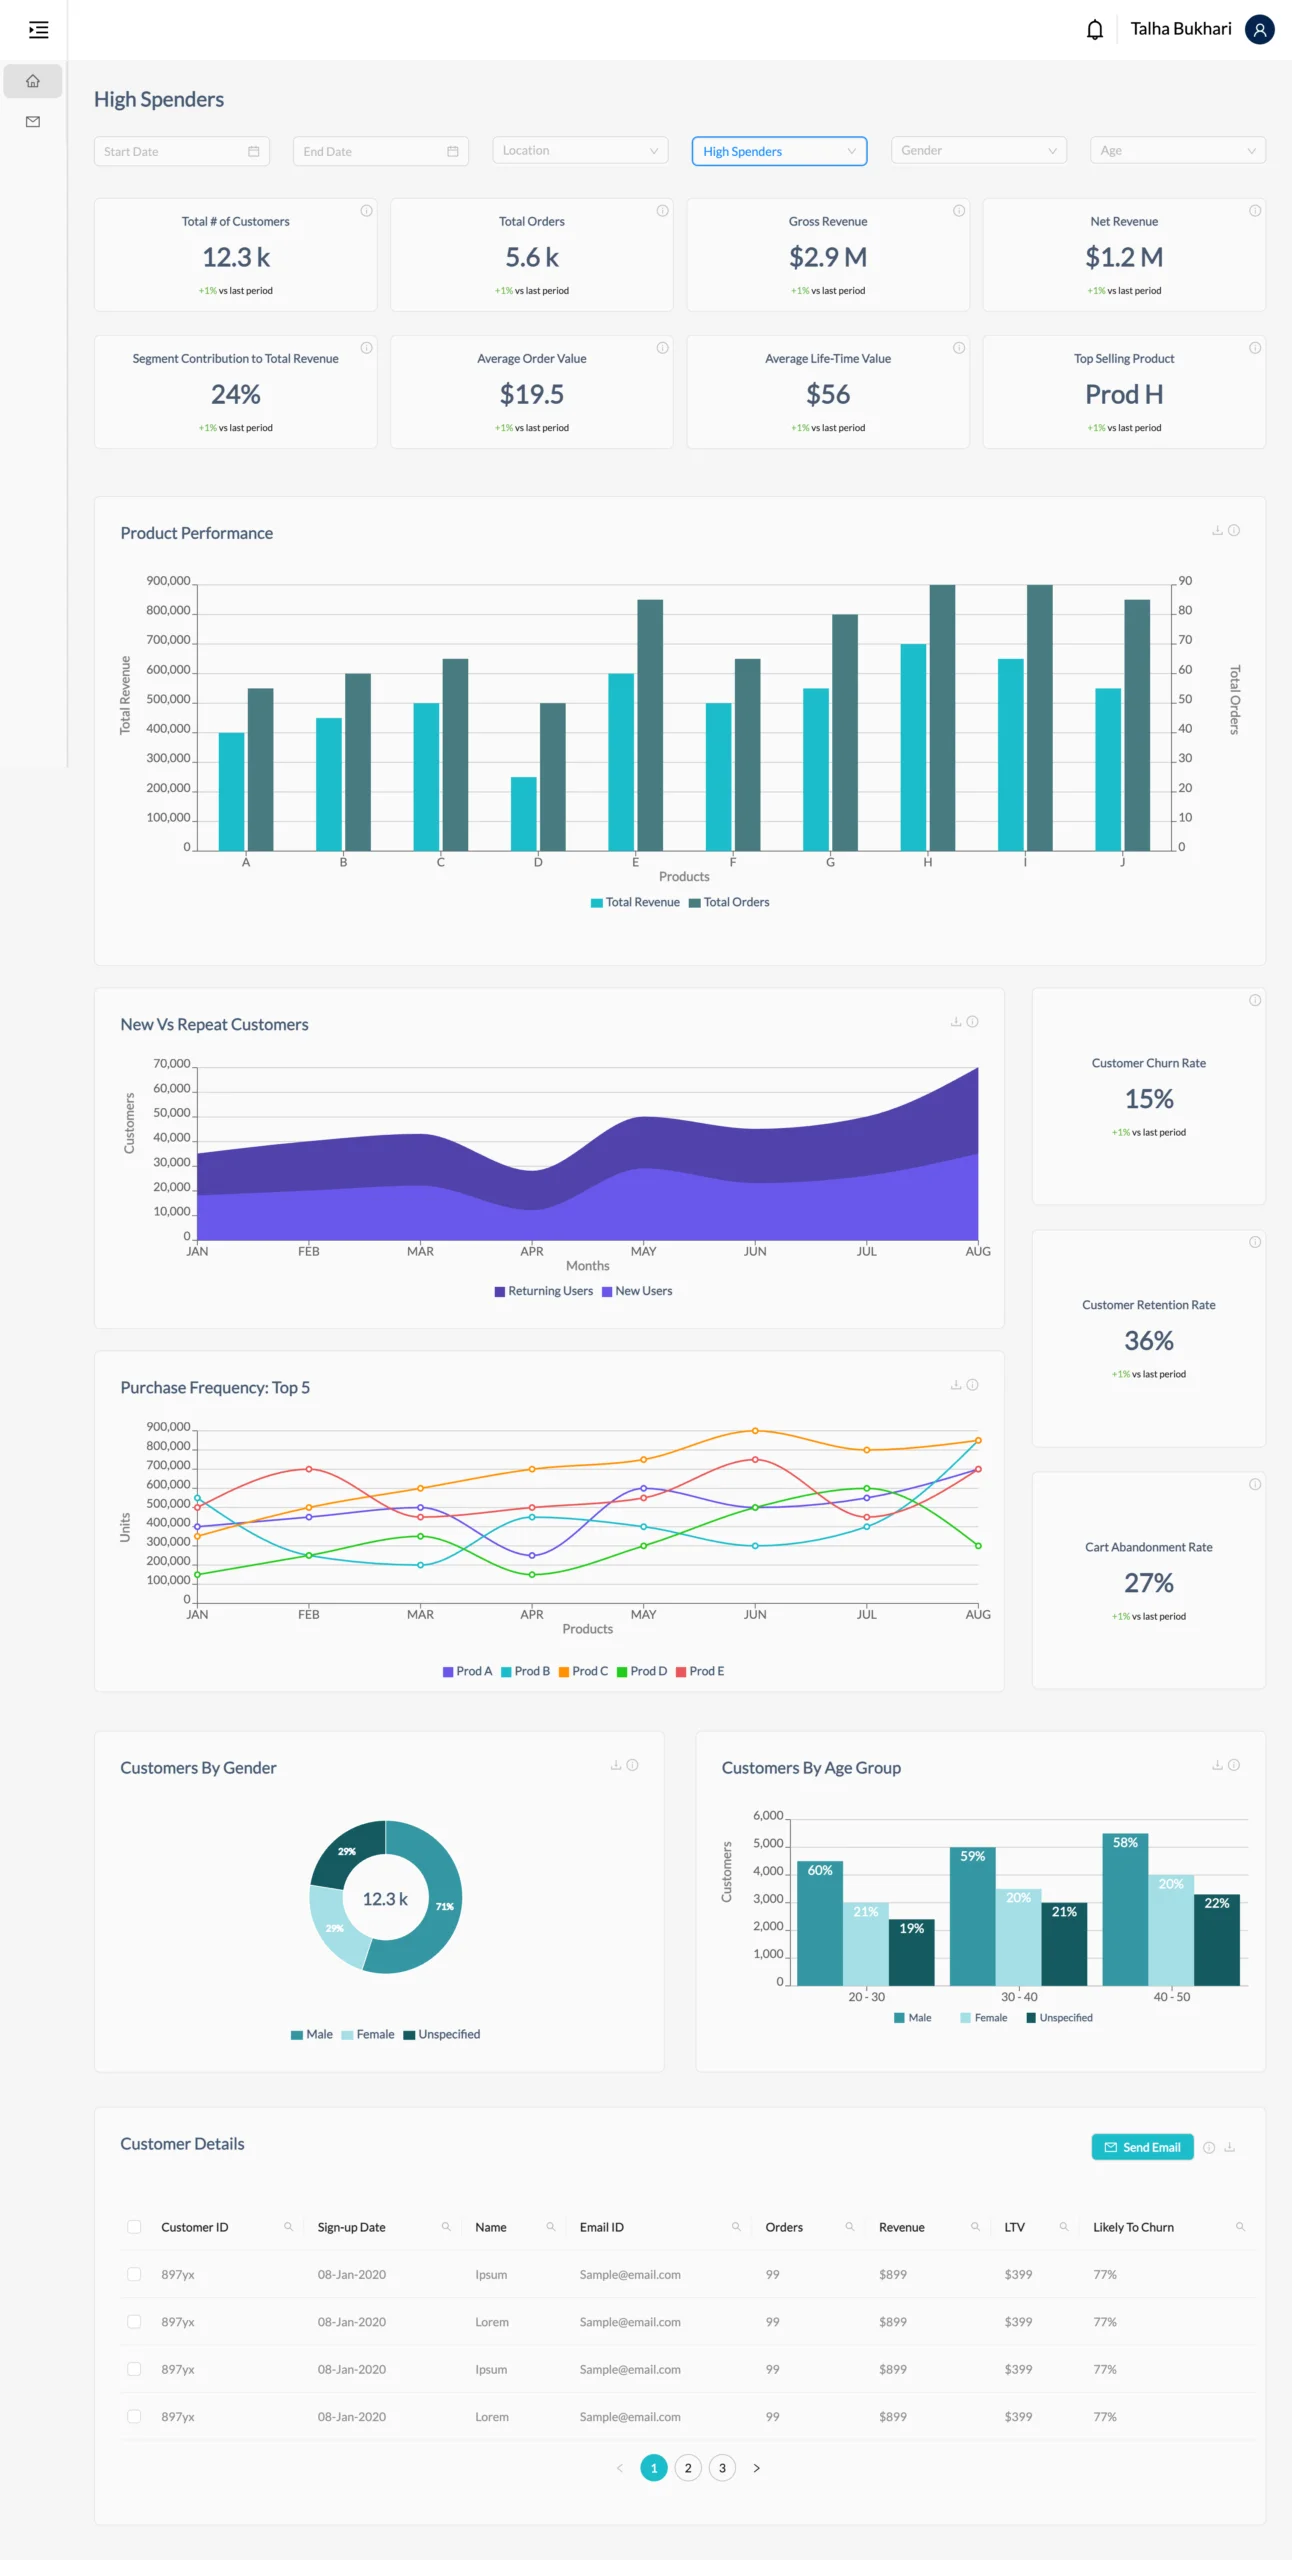
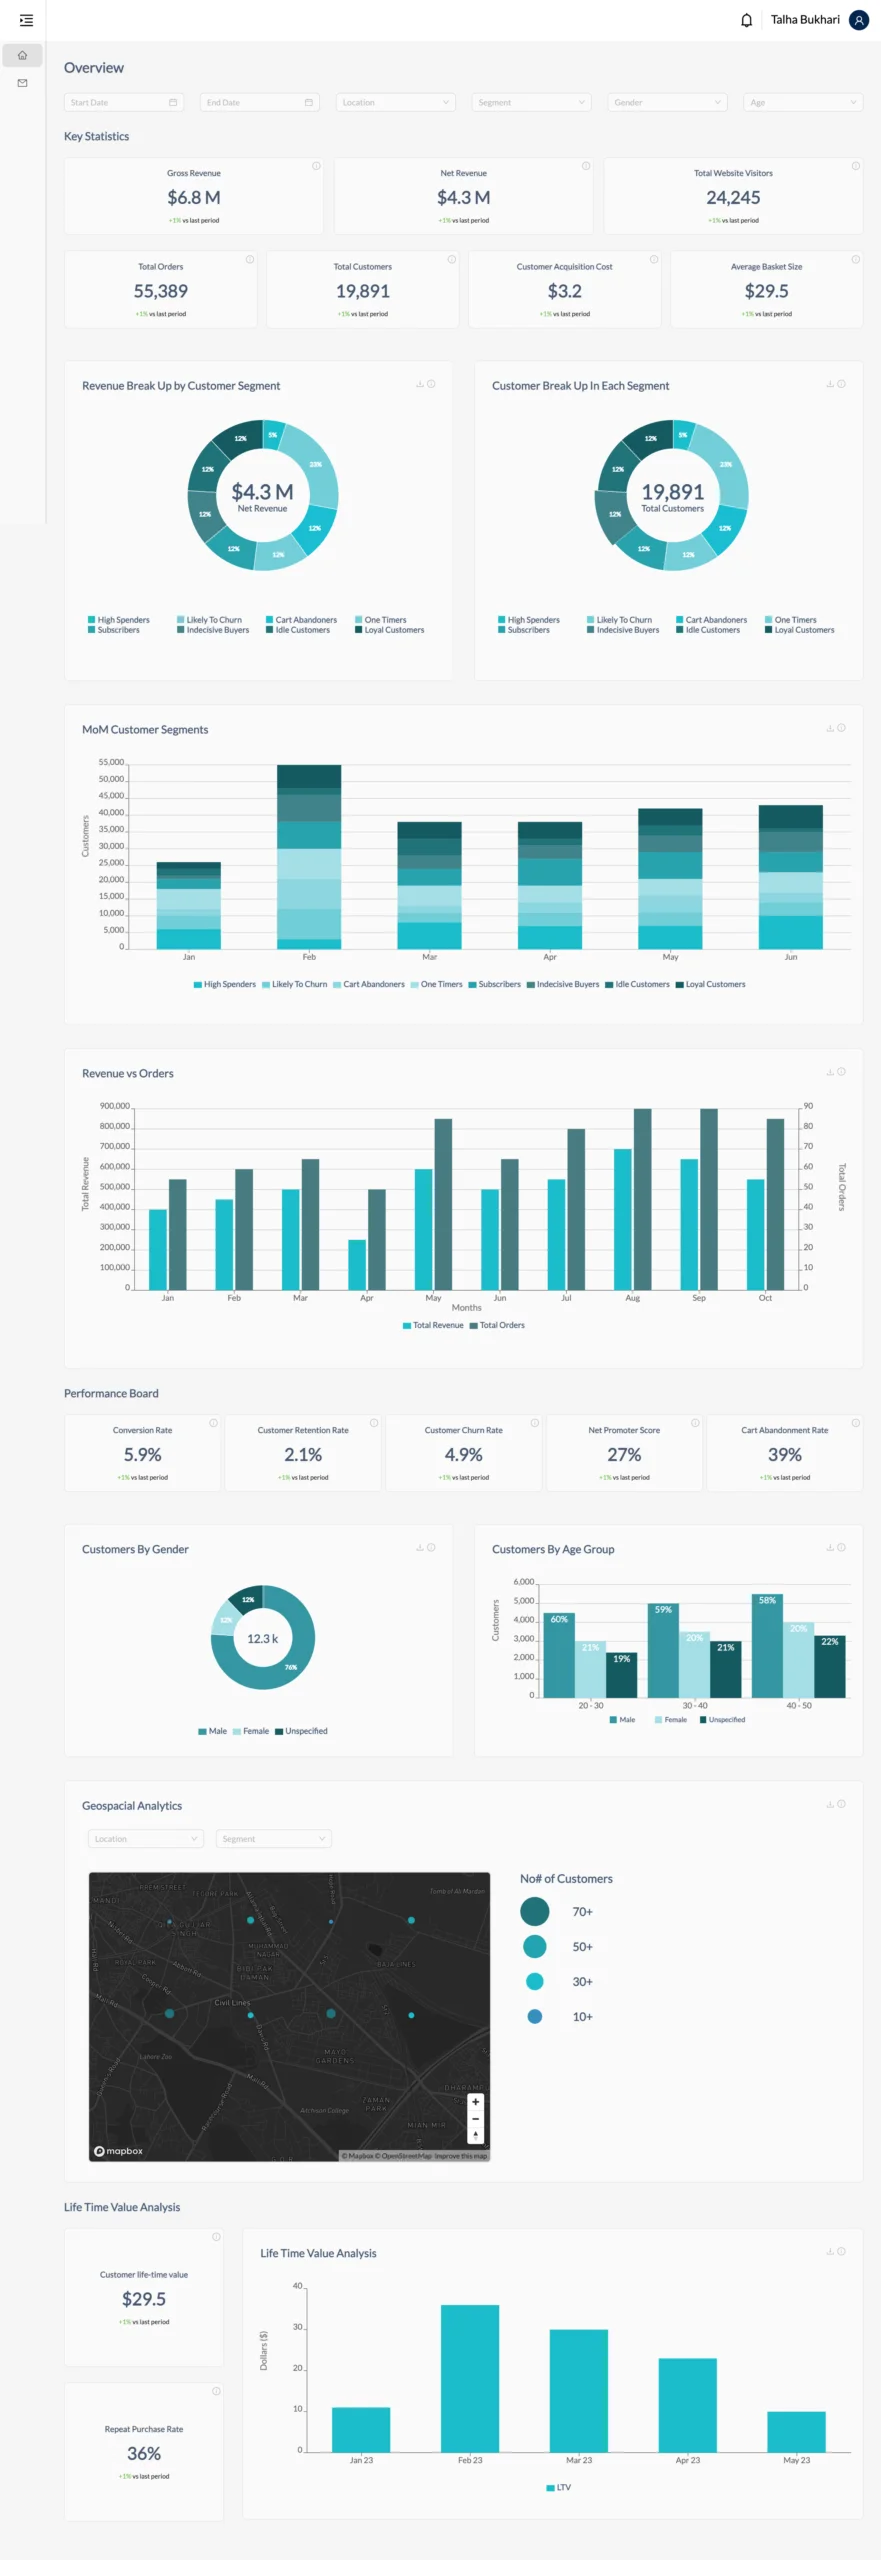
Here are a few dashboard examples that Data Pilot created:
Marketing Analytics vs. Customer Analytics
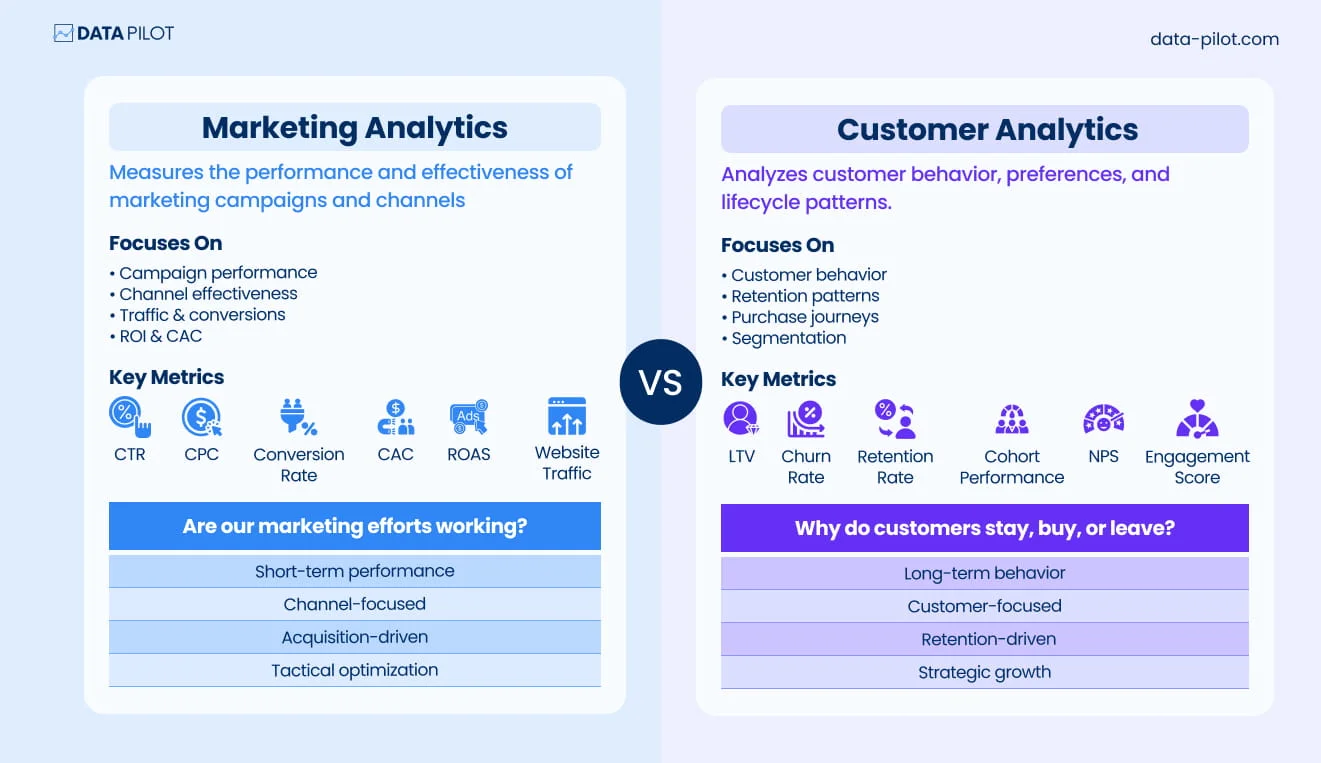
Marketing analytics and customer analytics use cases are related but very different. Marketing analytics focuses on campaigns: clicks, impressions, open rates, and ROI. It tells you which channels perform but doesn’t explain how customers behave or impact long-term value. For example, a social media ad might drive 5,000 clicks, but how many of those users become loyal customers?
Customer analytics use cases, on the other hand, provide a full view of the customer lifecycle, from acquisition to retention to expansion. They reveal which segments are most valuable, why churn happens, and where leadership should act to drive growth. For instance, analytics might show that users acquired through certain campaigns churn faster, allowing executives to optimize onboarding or shift budgets to higher-value channels.
In short: marketing analytics measures performance; customer analytics use cases drive strategic decisions that grow revenue, improve retention, and maximize lifetime value.
10 Minutes to Total Data Clarity
Stop the guesswork. Get an instant snapshot of your data maturity across 5 DAMA pillars and see exactly where you stand.

How to Build a Strong Customer Analytics Framework
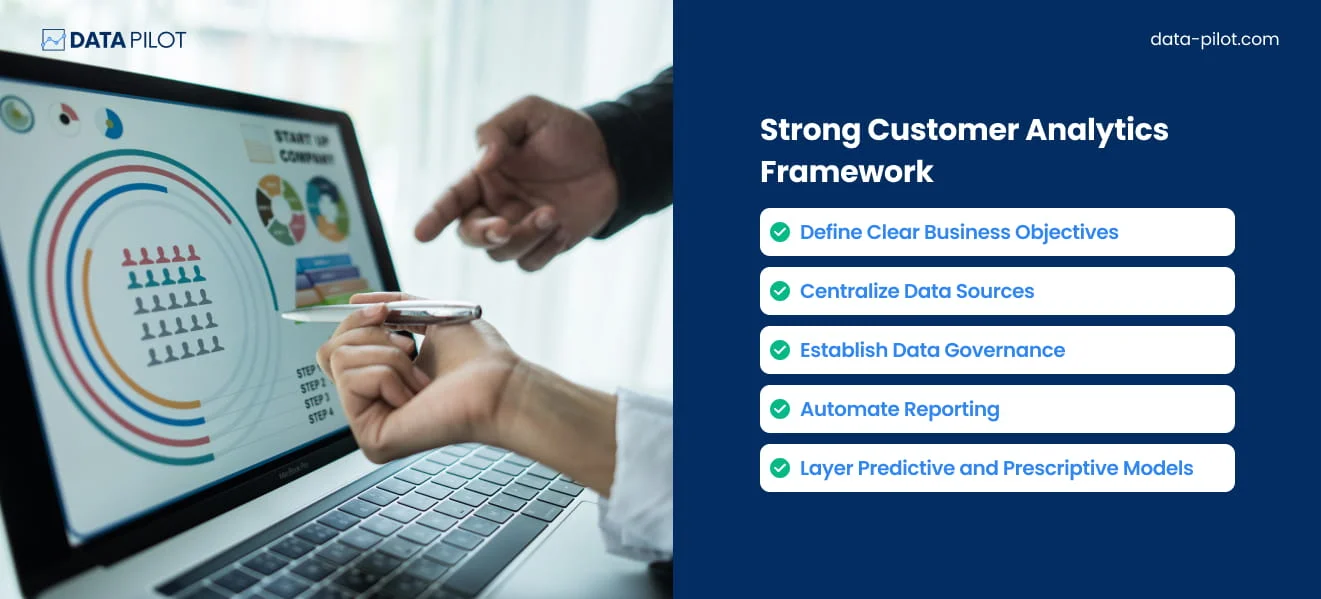
A practical framework includes:
1. Define Clear Business Objectives
Customer analytics should never start with a dashboard. It should start with direction. What exactly is the business trying to achieve right now?
- Are you optimizing for growth and new customer acquisition?
- Are you focused on improving retention and reducing churn?
- Is profitability the priority, with tighter CAC and stronger lifetime value?
- Are you expanding into new markets or segments?
Without clarity on the objective, teams end up tracking everything and optimizing nothing. Metrics become noise instead of guidance.
When the goal is clearly defined, analytics becomes focused. You know which KPIs matter, which trade-offs are acceptable, and which signals deserve attention. Data stops being descriptive and starts becoming directional.
2. Centralize Data Sources
Once objectives are clear, the next step is consolidation. Customer data cannot live in silos if you expect cohesive insights. CRM data, marketing automation platforms, product analytics tools, billing systems, and revenue reports all tell part of the story. If they are not integrated, the story remains incomplete.
Centralizing data into a unified, real-time dashboard creates visibility across the entire customer lifecycle. Acquisition connects to activation. Activation connects to retention. Retention connects to revenue. Instead of jumping between tools or reconciling conflicting reports, teams can see performance in one place.
That single source of truth becomes the foundation for alignment, accountability, and smarter decision-making.
3. Establish Data Governance
Even the best infrastructure falls apart without clear standards. Data governance is what keeps analytics reliable over time. That means defining consistent tracking rules, standardized naming conventions, shared metric definitions, and clear reporting structures across teams.
Without governance, dashboards slowly drift out of sync. Metrics get redefined. New tools get added without alignment. Confidence erodes. With governance in place, data stays clean, comparable, and scalable as the company grows. It becomes a system, not a series of one-off fixes.
4. Automate Reporting
Analytics loses its value when teams spend more time compiling reports than interpreting them. Manual exports, spreadsheet stitching, and last-minute reconciliations create friction and delay.
Automating reporting shifts the focus from assembling numbers to understanding them. Real-time dashboards replace static monthly decks. Instead of reacting to outdated reports, teams can spot trends as they emerge and act quickly. Speed becomes a competitive advantage.
5. Layer Predictive and Prescriptive Models
Historical reporting explains what happened. Mature analytics goes further. It helps answer what is likely to happen next and what should be done about it.
By layering predictive and prescriptive models on top of clean, centralized data, companies can forecast churn risk, estimate customer lifetime value, optimize budget allocation, and prioritize high-impact segments.
This is where analytics moves from insight to decision support and then to higher ROI.
The ROI of Customer Analytics
When implemented correctly, customer analytics drives tangible business outcomes.
- Lowers customer acquisition costs by identifying the channels and segments that convert efficiently.
- Increases lifetime value by highlighting behaviors linked to retention and expansion.
- Improves retention by surfacing churn signals early.
- Sharpens campaign performance through clearer attribution and optimization.
- Shortens decision cycles because leaders no longer wait for reconciled reports.
- Strengthens margins by aligning spend with measurable impact.
Research consistently shows that companies using advanced analytics are far more likely to outperform competitors in both profitability and growth. The advantage is accurate decisions, made faster, with confidence.
The Future of Customer Analytics
Customer analytics is evolving faster than ever, moving beyond descriptive dashboards into predictive and prescriptive realms.
In the near future, we can expect analytics to become hyper-personalized, leveraging AI and machine learning to anticipate customer needs before they even express them.
Real-time decision-making will be the norm, with insights drawn not only from structured transactional data but also from unstructured sources like social media, IoT devices, and voice interactions.
Privacy-conscious analytics will also grow in importance, balancing personalization with regulatory compliance and customer trust.
Ultimately, the future of customer analytics is about creating seamless, intelligent, and proactive customer experiences that drive loyalty, efficiency, and revenue growth.
Final Thoughts
As businesses continue to collect more data than ever before, the ability to extract meaningful insights will distinguish market leaders from followers.
Customer analytics is a strategic necessity. By combining robust data governance, advanced modeling, and actionable insights, companies can not only understand their customers today but also anticipate tomorrow’s trends. Investing in customer analytics is investing in a smarter, more agile, and customer-centric future.