You’re stuck in the same loop. Pipelines break, definitions don’t match, and every quick question turns into a Slack fire drill. Meanwhile, your stakeholders want AI, better forecasts, and faster decisions, but you can’t get the budget for cleanup. You need a way to show that the mess has a real price tag.
A data maturity assessment PDF gives you that bridge. It turns technical debt into business terms, like hours lost, revenue risk, and slower growth bets. More importantly, it gives you a plan you can defend.
In 2026, the fastest path to alignment is an interactive, shareable PDF report, not another slide deck that dies in a folder. When your assessment finishes in under an hour, you can walk into the next planning meeting with evidence, a clear baseline, and a 90-day path that feels doable.
Why Data Maturity is the New Competitive Ceiling
In 2026, you don’t have an AI problem, you have a data maturity problem. If your core tables don’t reconcile and your KPIs don’t agree, AI just scales confusion. It produces confident-sounding answers built on shaky inputs.
This hits a growing business’s team the hardest. You’re often data-rich but insight poor. The data exists in your CRM, ERP, support tool, product events, and billing system. Yet the work still happens in spreadsheets because the official numbers arrive late, or nobody trusts them.
Competitors don’t win because they use more tools. They win because they can answer basic questions faster:
- Which segments are growing, and why?
- What changed in churn last month?
- Can we trust the pipeline forecast this week?
If your team can’t answer those questions without manual cleanup, your speed drops. Sales and marketing slow down, finance adds buffers, and product bets get smaller. Over time, that becomes your competitive ceiling.
If your best analysts spend their days reconciling metrics, you’re not doing analytics, you’re doing data repair.
What is a Data Maturity Assessment (And Why Most Companies Fail It)?
A data maturity assessment is a structured way to measure how well your company collects, manages, and uses data, then map that reality to an improvement plan. In plain terms, it answers: Where are we strong, where are we weak, and what should we fix first, so the business feels it?
The key is the middle ground. A useful assessment is not a compliance checklist, and it’s not a vague strategy deck. It’s a practical map from the current state to ROI. It gives you a baseline, highlights bottlenecks, and ties fixes to outcomes your CEO and CFO care about.
Most companies fail the assessment part because they treat it like homework. Common failure modes show up fast:
- You score theory instead of reality, so the results feel polite and wrong.
- Nobody owns the follow-through, so the report becomes a one-time event.
- You don’t tie findings to KPIs, so leadership hears data stuff, not business risk.
- Only IT scores it, so adoption, trust, and workflow pain get missed.
- The results sit in a slide deck, not a living plan with deadlines and owners.
- Change management gets ignored, so even good fixes don’t get used.
If you want a reference point for what structured looks like, the public sector often gets this right because they must be explicit. The UK framework is a good example of clear categories and measurable behaviors in a data maturity assessment framework.
A weak assessment sounds like: We should improve governance and build a better warehouse. A useful assessment sounds like: Revenue is defined three ways, finance closes take two extra days, and we lose 15 hours a week to manual fixes. Here are the top three changes that cut that in 90 days.
The Gap You Need to Bridge: Technical Debt vs Business ROI
Technical debt doesn’t stay technical for long. It turns into operating cost and missed opportunities. Watch for these symptoms, because each one has a direct business result:
- Manual cleanup before every report: Your cycle time grows, so decisions land late.
- Two sources for the same metric: Teams argue, meetings drag, and trust drops.
- Pipeline failures nobody notices: You ship broken dashboards, then leaders stop using them.
- Duplicated tools and extracts: Costs creep up, and security risk spreads.
- Slow access approvals: Analysts wait, so stakeholders build shadow spreadsheets.
When you frame the pain this way, the data budget becomes a growth budget.
What a Strong 2026 Assessment Measures (Beyond a Simple Score)
A 2026-ready assessment should give you more than a grade. You need outputs that lead to action:
- A baseline across key areas
- Cost and risk hotspots, so you can quantify what’s breaking the business
- A prioritized fix list, not a wish list
- Quick wins you can ship in 0 to 90 days
- A 90-day plan with owners and proof points
AI readiness can’t be a separate worksheet anymore. If your assessment ignores data labeling, lineage, permissions, and repeatable pipelines, you’ll fund AI experiments that stall in production.
10 Minutes to Total Data Clarity
Stop the guesswork. Get an instant snapshot of your data maturity across 5 DAMA pillars and see exactly where you stand.

The 5 Pillars of a Modern Data Strategy in 2026
Think of these pillars like the load-bearing walls of your data house. You can decorate later. First, you need a structure that doesn’t collapse when someone asks for a new metric.
Data Governance and Quality: Is Your Data a Single Source of Truth or a Swamp?
Good looks like shared definitions, clear ownership, and quality checks that run without begging someone on Slack. You don’t need a giant committee. You need agreement on the few metrics that run the business.
Stuck looks like the same metric defined three ways. For example, revenue might mean booked, billed, or collected depending on who speaks. Churn might differ between product, success, and finance.
Proof points you can gather quickly:
- How many definitions exist for your top 10 metrics?
- How often do you re-run reports due to data errors?
When definitions match, meetings get shorter. You spend less time defending numbers and more time acting on them.
Infrastructure and Scalability: Getting Out of Legacy Silos Without Breaking Everything
Good looks like a sensible stack that integrates core sources, monitors pipelines, and controls cost. It also includes staged modernization. You don’t need a big bang rebuild to improve reliability.
Stuck looks like brittle scripts, missing monitoring, and a warehouse that only one person understands. On top of that, legacy silos keep critical data locked behind slow exports.
Proof points you can pull:
- How long does it take to trace a KPI from dashboard to raw source?
- How often do pipelines fail without an alert?
If you can’t trust your data plumbing, everything upstream becomes guesswork.
Analytics and AI Readiness: Can Your Data Actually Power Useful Models?
AI needs clean, consistent, well-labeled data, plus pipelines you can repeat. Ready enough doesn’t mean perfect. It means you can support one high-value use case end to end.
Good looks like stable datasets, tracked schema changes, and permissions that match how the business works. You can reproduce training data, explain where fields came from, and limit access to sensitive columns.
Stuck often shows up as:
- Missing history, so you can’t train on past behavior
- Messy joins, so entities don’t match across systems
- Untracked changes, so features shift without warning
- Unclear permissions, so governance blocks progress late
For broader context on how governance maturity supports speed, the TDWI data governance maturity model assessment guide is a helpful read.
Proof points to collect:
- Time to answer a simple question, like weekly churn drivers
- Number of manual steps in your model training or feature refresh
People and Culture: Getting Your Team to Actually Use the Data
You can build perfect tables and still fail if nobody uses them. Good looks like self-serve analytics for common questions and a short path from question to decision.
Stuck looks like endless one-off requests, custom reports for every leader, and dashboards that nobody opens after the first week.
Proof points:
- How many one-off reports do you deliver per month?
- What share of decisions rely on shared dashboards versus personal spreadsheets?
Adoption improves when your metrics match reality and your tools match workflows. Training helps, but trust does more.
Data Ethics and Compliance: Staying Safe in the 2026 Regulatory Landscape
This isn’t legal advice, it’s operations. Good looks like clear access control, retention rules you can explain, and audit trails for key datasets. If you handle customer data, you also need a practical path to respond to privacy requests.
Stuck looks like broad access because it’s easier, sensitive data copied into extracts, and no record of who changed what. That turns into surprise incidents and emergency reviews.
Proof points:
- How many places store PII or sensitive fields?
- Can you show who accessed a critical dataset last month?
Trust and safety protect growth because they prevent chaos right when you’re trying to scale.
The 4 Stages of the Journey: Where Do You Sit?
You don’t need perfection, you need to know your current stage so your next step makes sense.
Here’s a simple way to place your team:
| Stage | What it looks like day to day | Common risk |
| 1. The Explorer (Ad-Hoc) | Manual entry, siloed files, gut-feel calls | Decisions drift, errors hide |
| 2. The User (Foundational) | Central CRM or ERP, reactive reporting | Teams don’t trust numbers |
| 3. The Leader (Standardized) | Cleaner pipelines, shared KPIs, AI pilots | Scale breaks without governance |
| 4. The Innovator (Transformative) | Automation runs ops, AI is core | Model risk and controls matter |
If you’re trying to plan AI investment by stage, this SMB AI maturity model overview gives you a clear sequencing mindset. Your data maturity assessment should line up with that same idea: build the foundation before you automate the whole house.
How to Use the Data Maturity Assessment PDF to Drive Growth
A strong data maturity assessment pdf acts like portable authority. It’s easier to circulate than a working session, and it feels more objective than “the data team says we need time.” That matters when you’re asking for headcount, tooling, or a pause on feature work to fix core pipelines.
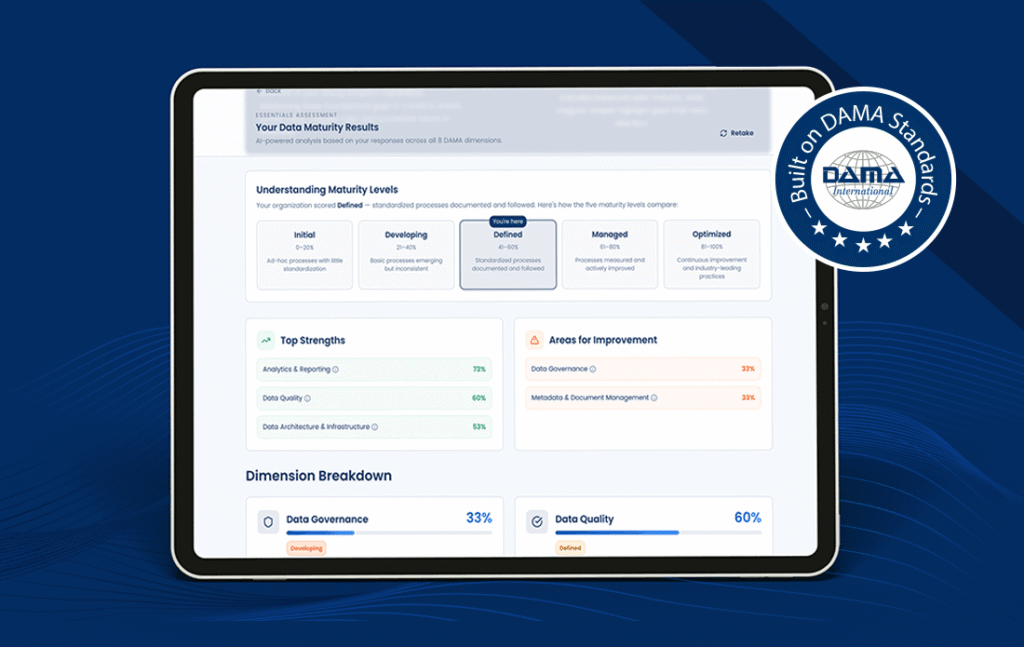
The best reports also read well at two levels. Executives can scan the headline findings. Your team can use the detailed scoring to plan work. If your assessment is DAMA-aligned, you’ll often see the results organized by data management areas, with a radar view that makes gaps obvious. When AI readiness is included (often based on well-known maturity roadmaps), you can show why model efforts will stall without certain prerequisites.
Use the PDF as a business case in a box:
- It connects a broken process to a business impact.
- It ranks fixes by expected value and urgency.
- It gives you quick wins and longer platform work, side by side.
- It creates a shared language across data, IT, finance, and ops.
How to Read Your Results
Don’t chase a higher score everywhere. Instead, look for constraints that slow every team. Definitions, access delays, pipeline failures, and manual cleanup usually show up as multiplier problems.
Then pick two to three priorities only. Split them into:
- Quick wins (0 to 90 days), like metric definitions, data tests, or access fixes
- Platform work, like restructuring pipelines, reducing tool duplication, or adding monitoring
You’re trying to create momentum, not a perfect roadmap.
How to Take the Report to a Board Meeting or Planning Session
Walk in with a tight script, and keep it measurable:
- The business problem: Forecast accuracy is off, and close takes longer.
- Evidence from the PDF: Three revenue definitions, plus weekly manual fixes.
- Cost of doing nothing: X hours per week, delayed decisions, higher incident risk.
- The roadmap: 90-day plan with owners, quick wins, and platform steps.
- The ask: People, tools, and protected time
Board-friendly metrics help. Use hours saved, faster close, fewer data incidents, and improved forecast accuracy. Tie each to a date and an owner.
How to Generate Your Custom Data Maturity PDF (Step-by-Step)
You want speed and structure, not a months-long audit. A practical flow looks like this:
- Take a structured assessment that covers core data management areas (many teams use DAMA-aligned categories).
- Add a short AI readiness section, so you can link foundation gaps to AI risk.
- Generate an interactive PDF that includes a radar chart, dimension scores, and prioritized recommendations.
- Share it with leadership, then lock the first 90-day plan.
The result should include the pieces you’ll actually use: gap analysis, area-by-area scoring, quick wins, and a short roadmap. If the tool offers tiers, start with a fast baseline, then move to a deeper diagnostic when you need more detail for funding.
Data Pilot’s complimentary data maturity assessment tool is designed for a fast baseline. You can complete it quickly, then use the results to guide priorities. It’s DAMA-aligned, and helps you connect foundation work to realistic next steps.
Beyond the PDF: 3 Actionable Steps for Businesses to Level Up
You don’t need 20 initiatives. You need a focused sequence.
First, audit your stack and name the #1 bottleneck. It’s often a legacy silo that forces exports and manual joins. Fixing that one constraint can speed up every downstream report.
Next, define one North Star metric. Stop tracking everything and agree on what moves the needle. Then document it, assign an owner, and build quality checks around it.
Finally, build an AI roadmap that respects reality. Don’t buy AI tools first and hope the data catches up. Use your assessment to pick one use case where the inputs are stable, the outcome is measurable, and the pipeline can run repeatedly.
Final Thoughts
In 2026, a data maturity assessment only matters if it connects data work to outcomes. A strong data maturity assessment pdf gives you that connection, plus a plan you can defend. It turns cleanup into reduced manual hours, faster decisions, and lower risk, which is what leadership funds.
AI success follows the same rule. If your pipelines, definitions, and controls aren’t mature enough, AI will stall or ship bad answers faster.
Run the Data Pilot assessment, generate the PDF report, share it with stakeholders, and commit to a focused 90-day improvement plan. Then use the next quarter to prove momentum with two to three measurable wins.