If you’re in the C-suite, you’ve probably funded data platforms, dashboards, and modernization more than once. Yet the business still argues about numbers, projects slip, and every big decision feels riskier than it should.
That’s what low data maturity looks like. It’s not about how much data you have. It’s about how consistent, trusted, and business-driven your data practices are across teams.
Below is a simple walkthrough of the common maturity levels, what each level feels like day to day, and what to fix next so you stop guessing and start funding the right work first.
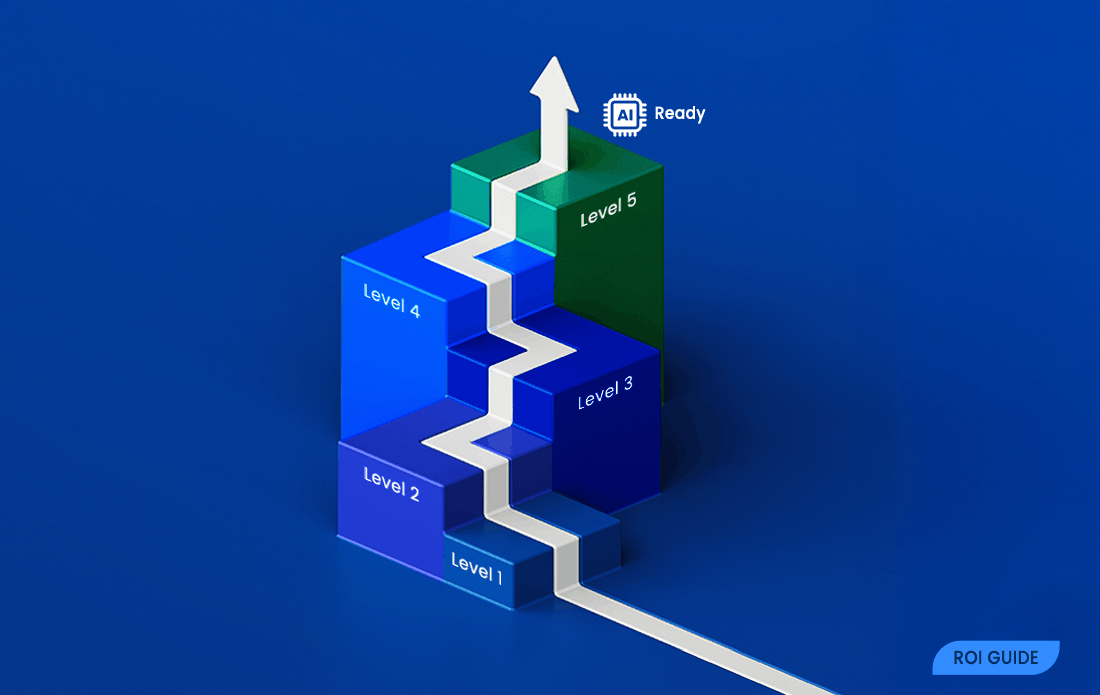
The 5 Levels of Data Maturity
Most maturity models follow a staged path, even if they use different names. Think of the 1 to 5 scale like home construction. Level 1 is camping on the lot. Level 3 is a solid house. Level 5 is a well-run property with maintenance, security, and room to expand.
Here’s the fast self-check before you read the details:
| Level | What it feels like | Business impact | What to do next |
| 1 | Constant fire drills | Slow decisions, high surprises | Pick critical metrics, name owners |
| 2 | Some order, still messy | Duplicate work, two truths | Standardize sources, basic checks |
| 3 | Core reporting is trusted | Faster planning, fewer disputes | Expand governance beyond reports |
| 4 | Managed like a business system | Lower incident cost, better ops | Monitor, automate, tie to outcomes |
| 5 | AI-ready foundations | Scalable growth use cases | Stay disciplined, scale responsibly |
The takeaway: you don’t need perfect data. You need the next level that reduces risk and improves decision speed.
Level 1: Ad Hoc Data
Day to day, Level 1 feels like you’re running the business on spreadsheets, tribal knowledge, and heroics. Definitions change by department. One team’s active customer doesn’t match another’s. People export, patch, and re-upload data because it’s faster than fixing the source.
The business impact shows up fast: planning cycles drag, forecasts surprise you, and leadership meetings turn into debates about whose dashboard is right. Risk climbs too, because access rules and audit trails tend to be unclear.
Next actions that work:
- Choose 5 to 10 critical metrics (revenue, margin, churn, inventory turns, on-time delivery).
- Assign an owner for each metric who can approve a definition.
- Write down definitions in plain language and publish them where teams can find them.
Level 2: Repeatable But Inconsistent
At Level 2, you’ve built some structure. You might have a BI tool, a data warehouse, or a single source initiative. The problem is adoption. Some teams follow the process, others keep their own spreadsheets or build shadow pipelines.
This is where ‘two versions of the truth’ becomes a weekly tax. You also tend to see duplicated tools, duplicated integrations, and multiple extracts of the same data. Costs rise while confidence stays shaky.
If you’ve seen four-stage models, this may map to the early middle. Heap’s breakdown of the four stages of data maturity can help you translate between frameworks.
Next actions that work:
- Standardize the sources for your most important KPIs (one system of record per domain).
- Add basic data quality checks (completeness, uniqueness, freshness).
- Start a lightweight governance rhythm (a monthly review of KPI changes, key issues, and owners).
Level 3: Defined and Governed
Level 3 is the point where core reporting starts to feel stable. Teams share definitions for key KPIs. Ownership is clearer. When something breaks, you know who can fix it. As a result, fewer meetings get stuck on data debates.
Business outcomes improve in visible ways. Planning cycles shorten because you don’t spend days reconciling. Operational risk drops because access and change control are less random. You can still have problems, but you can trace them.
Next actions that work:
- Extend governance beyond dashboards into master data (customer, product, location).
- Invest in metadata so people can find data and understand meaning.
- Tighten access controls so sensitive data is protected without blocking work.
Level 4: Measured and Optimized
At Level 4, you stop treating data like a one-time project. You manage it like a living system, similar to finance controls or plant maintenance. You set targets for data quality and pipeline health, then measure them.
That changes behavior. Teams prioritize fixes that reduce incidents, speed reporting, and improve customer or supply chain outcomes. You also get better at cost control because you can see where time and money go (and where rework is hiding).
Next actions that work:
- Improve monitoring (freshness, failures, anomalies) with clear alert owners.
- Automate checks so issues surface early, not at the exec meeting.
- Tie the backlog to outcomes (margin, churn, CAC payback, on-time delivery).
Level 5: Transformational and AI-ready
Level 5 is where AI-ready starts to mean something real. You have reliable, governed data, but you also have disciplined execution: clear use cases, measurable impact, and responsible controls around privacy, bias, and model drift.
This level does not come from buying more tools. It comes from strong foundations plus consistent operating habits. When you have those, AI and advanced analytics can scale without turning into a compliance headache or a never-ending pilot.
Business outcomes tend to show up as personalization that actually works, forecasting that stays stable, faster product decisions, and fewer unpleasant surprises from unknown unknowns.
If your data foundation is shaky, AI tends to multiply the mess. If your foundation is solid, AI can multiply the value.
How to Spot Your Level Using Business Signals, Not IT Jargon
You don’t need an architecture diagram to diagnose maturity. You can spot it through friction, speed, and confidence.
In retail and e-commerce, maturity shows up in inventory accuracy, promotion reporting, and how quickly you can answer “what changed this week?” In SaaS, it shows up in churn definitions, pipeline coverage, and whether product analytics matches billing. In manufacturing and logistics, it shows up in schedule stability, supplier performance, and how often planners override system numbers.
Decision Confidence: Do Leaders Debate the Numbers or the Choices?
Low maturity doesn’t just create wrong numbers. It steals time. When leadership debates dashboards, you delay decisions, and the cost of delay is real.
Use a quick self-check in your next staff meeting:
- How often do KPI definitions change without notice?
- How many sources feed a single KPI (and do they match)?
- How long does it take to reconcile a simple metric like revenue by segment?
- How often do you rerun last month’s report and get a different result?
If the meeting often ends with “we’ll validate and follow up,” you’re paying for uncertainty in payroll hours and missed opportunities.
Operational Drag: How Much Manual Work is Hiding in Your Reporting
Operational drag is the hidden tax of low maturity. It looks like analysts doing spreadsheet patching, leaders waiting for one person to run a report, and teams building one-off extracts for every new question.
That drag hits close cycles, forecasting, and customer response times. It also increases key-person risk, because the process lives in someone’s head.
A practical first target: pick the most used recurring report (weekly sales, daily fulfillment, monthly churn), then do two things. First, automate the pipeline. Second, standardize the input data so the report stops changing based on who ran it.
Where DAMA Fits, and How to Use It to Make Maturity Measurable
Maturity gets messy when it’s just a vibe. One leader thinks you’re advanced because you bought a warehouse. Another thinks you’re behind because reporting still hurts. You need a shared yardstick.
That’s where DAMA helps. DAMA International is a global professional association that defines best practices and standards for data management and governance. The practical benefit is simple: instead of grading maturity as one big score, you can assess it across the major knowledge areas that keep data usable, safe, and trusted.
A Simple Way to Think About DAMA Knowledge Areas
DAMA pushes you to look at the full system, not just tools. If you invest heavily in infrastructure but ignore governance, quality, and metadata, you often end up with expensive confusion.
An executive-friendly way to frame it is:
- How you define data (ownership, terms, master data)
- How you control data (privacy, access, change control)
- How you improve data (quality checks, issue management)
- How you deliver data (pipelines, reliability, availability)
This balanced view prevents over-spend in one area while another becomes the bottleneck.
How a DAMA-aligned Maturity Radar Helps You Prioritize Spend
A radar or scorecard view works because it creates fast alignment. Leaders can see strengths and gaps at a glance, then focus on the few gaps that create the biggest risk or block the biggest outcomes.
A 1 to 5 scoring model also helps your teams. Clear level descriptions reduce argument, because people stop debating labels and start comparing behaviors. You can then fund the work that moves a weak area up one level, instead of spreading money thin across everything.
A Fast Way to Assess Your Data Maturity and Turn It Into a Short Roadmap
If you’re tired of funding data work without clear outcomes, a structured assessment is the fastest reset. It turns “we think” into “we know,” and it gives you a short list of fixes that matter.
Data Pilot’s free data maturity assessment is designed for this moment. You can complete it quickly, then use the results to guide priorities. It’s DAMA-aligned, and helps you connect foundation work to realistic next steps.
What You Get When You Measure Maturity the Right Way
A good assessment should drive action, not create another PDF nobody reads. When you measure maturity well, you get:
- A maturity radar across key data management areas, so gaps are visible.
- Dimension scores with plain-language explanations.
- Prioritized recommendations, ordered by likely business impact.
- A shareable report you can bring to leadership or a governance group.
The point is to stop guessing. You fund a small set of fixes, then you track improvement like any other business system.
Who This Is Built For, and Why It Is Worth Doing Now
This approach fits founders and executives who want ROI, less risk, and a realistic path to AI. It’s worth doing now if you’ve had any of these triggers recently: a failed AI pilot, constant reporting disputes, growing compliance anxiety, a major system change, or high-stakes decisions made with low confidence.
It also helps when you need to choose between options. A quick snapshot can tell you whether the next dollar should go to data quality, governance, access controls, or reliability, before you spend on another tool.
Final Thoughts
Data maturity is a progression. When you measure it, you can manage it. Start by naming your current level, then choose the next level that improves decision speed and reduces risk. After that, fund a few changes tied to outcomes, not vanity projects.
If you want a fast, structured way to get clarity and a short roadmap, take a maturity snapshot and use it to align spend, lower liability, and build toward AI with confidence.