 Companies lose a ton of money each year by misanalyzing marketing performance. Matched pairs analysis saves the day by comparing what you did with something similar to see if you strategically moved the needle or if it was just a stroke of luck. Matched pair analysis sounds like an intimidating statistical term, but once you look past the jargon, it only means comparing things fairly. It’s about comparing two closely related measurements so you can clearly see what changed, like a before-and-after photo. Or comparing identical twins raised in different environments. The goal is simple: reduce distractions so the real difference stands out. Let’s break it down in plain language.
What Is Matched Pair Analysis?
Matched pair analysis is a method where data comes in pairs. Each pair represents two related measurements that are intentionally linked. Instead of comparing unrelated groups, you compare each item directly with its match. Why does this matter? This matters because it controls outside factors that might otherwise influence your results. Imagine testing whether a new teaching method helps students learn better. Instead of comparing two random classes, you measure the same students before and after the method. Each student is their own comparison point. Differences in intelligence, motivation, or study habits are naturally controlled as each student compares to themselves before and after the new teaching method is applied. On the other hand, imagine comparing the results of two classes, one adopting a certain method and the other a different method. The comparison points wouldn’t be the same, and accordingly, the results may be skewed or inaccurate. The two classes consist of different students with different levels of motivation, intelligence, and study habits, so they can’t be reasonably compared to one another. Comparing the students’ individual performance before and after the new method would be a better comparison point and would actually reveal if anything truly changed. This pairing structure reduces irrelevance and highlights meaningful information. It’s like lowering background chatter so you can hear the main conversation.
Why Pairing Creates Fair Comparisons
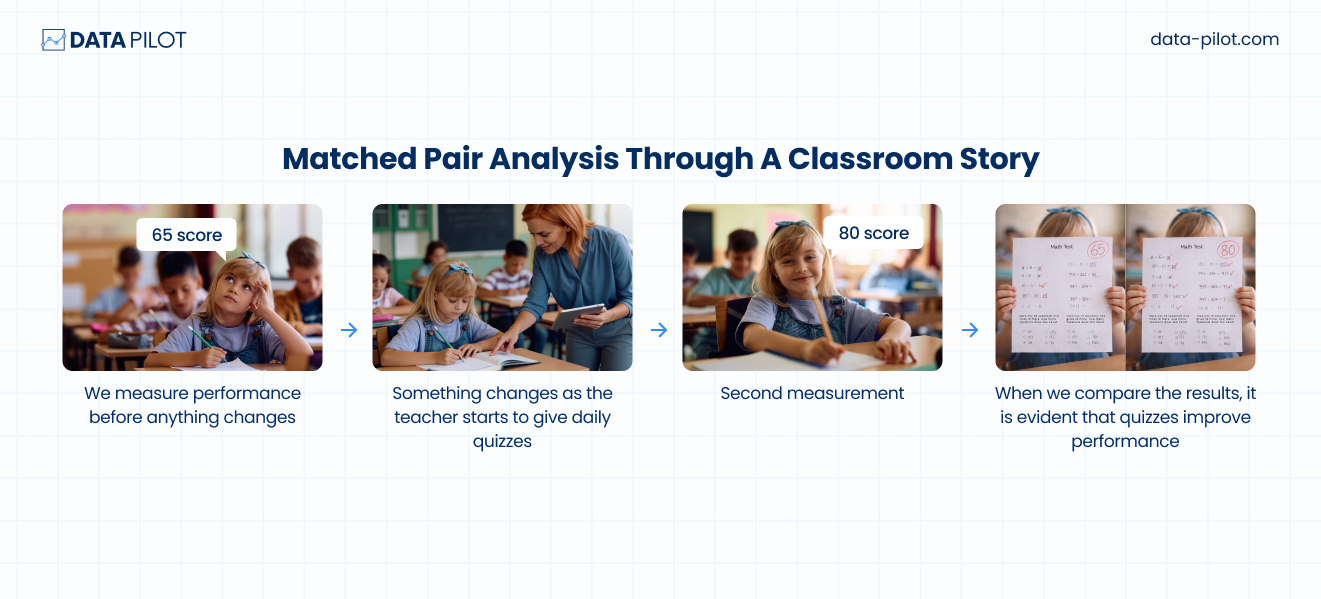 The strength of matched pair analysis is that it’s fair. When comparisons aren’t controlled, outside variables sneak in. Maybe one group was already stronger, conditions weren’t equal, or the two groups had different characteristics. Pairing removes that uncertainty and creates a solid basis for comparison. By linking related observations, analysts isolate the variable they actually care about. That’s why matched pair designs are considered statistically efficient and produce clearer results with fewer distractions. This doesn’t eliminate uncertainty. But it dramatically improves your chances of drawing accurate conclusions. Let’s look at the classroom story above. A student is taking a test and scores a 65. Nothing has changed. That’s the initial measurement. Now comes the intervention. The teacher starts giving daily quizzes, which causes the student to study, and after that, the student scores an 80. The results show that the intervention, which were the daily quizzes, improved performance.
The Main Types of Matched Pair Analysis
Not all pairing is the same. Researchers choose different matched pair structures depending on what they’re studying. Here are the most common types.
Before-and-After Design
This is the most intuitive version. You measure something, apply a change, then measure again. The difference between the two measurements becomes the focus. Medical studies use this approach. A patient’s blood pressure before treatment is paired with their reading afterward. Because the same person is measured twice, individual biological differences are controlled. The advantage here is simplicity. You don’t need a separate control group. But this method assumes no major outside factors influenced the results between measurements, which can be a hindrance to accuracy. For example, if we are measuring the same student’s performance before and after an intervention, we are assuming that only that intervention is causing the change.
Matched Subjects Design
Sometimes you can’t measure the same person twice under different conditions. That’s where matched subjects are used. Instead of pairing measurements from one individual, researchers pair different people who share important traits such as age, health status, background, or skill level. The goal is to create pairs that behave like controlled comparisons. If matching is done well, differences are more likely tied to the tested variable rather than random variation. Poor matching, however, weakens the entire study. That’s why this design requires careful planning. For example, researchers want to see the effects of cognitive behavioural therapy on adults with insomnia. They make pairs based on age and sleep patterns and test one before applying therapy, and the second after applying it. This way they can increase the likelihood that the therapy has caused the change in sleeping patterns, as two different individuals with some controlled variables are tested.
Also Read: A Practical Guide to Data Quality Management: FIx Hidden Problems in Your Data
Natural Pairs
Natural pairs already exist in the real world. Twins, siblings, or repeat customer behavior are good examples. As these pairs share inherent similarities, they act as built-in controls. Social science researchers often use natural pairs to explore how environment influences development while genetics remain constant. For example, researchers may test two athletes who are natural training partners because they share a training environment. Then, one athlete would be assigned to a new training method while the other would continue with the standard training method. After a set timeframe, their sprint time would be measured and compared. Table Example:
| Pair | Athlete ID | Age | Gender | Training Program | Sprint Time (s) |
| 1 | A01 | 20 | M | New Program | 10.8 |
| 1 | A02 | 20 | M | Standard Training | 11.2 |
| 2 | A03 | 22 | F | New Program | 12.3 |
| 2 | A04 | 22 | F | Standard Training | 12.8 |
| 3 | A05 | 19 | M | New Program | 10.5 |
| 3 | A06 | 19 | M | Standard Training | 10.9 |
Natural pairing reduces artificial manipulation and reflects real-life conditions.
Crossover Design
Crossover designs let the same people try more than one treatment in a study, so each person gets to experience each condition. In other words, every participant is compared to themselves before and after each treatment instead of comparing one person to a different group of people. This approach is efficient and gives rich comparison data because it reduces the differences between people that can confuse results. Researchers must plan carefully, though, so that the effects of the first treatment don’t stick around and influence the next one. For example, in a two-drug study, half the participants might be given Drug A first and then Drug B after a washout period, while the other half start with Drug B and then switch to Drug A. Crossover designs often need fewer participants to draw a conclusion because each person serves as their own control, and that makes the comparisons more powerful overall. many clinical trial reviews show that crossover studies make it easier to detect differences with smaller groups than parallel studies where each person only gets one treatment. According to research, only one-fifth of participants are needed in a crossover design rather than a parallel design that uses different subjects for each treatment to achieve the same level of significance.
Time-Based Pairing
Time-based pairing compares measurements taken from the same subject at different points in time, whether that’s hourly, monthly, quarterly, etc. Environmental scientists might track pollution levels seasonally. Businesses might compare quarterly performance. With time-based pairing, you can highlight trends and reveal meaningful shifts over time. Is Your Data Working as Hard as You Are?
How Matched Pair Analysis Works in Practice
A company designs a new website and wants to test whether the new design is more appealing for visitors and improves conversions. Many companies would compare the sales of each month to see if the website was converting better. Instead of comparing this month’s sales to last month’s (which could be affected by seasonality, promotions, or holidays), the company is advised to use matched pair analysis. Here’s how: They do an A/B test and take 30 days of traffic and split each day into two matched halves: 1) Half of the visitors see the old website 2) The other half see the new website Each day becomes a pair. For every single day, they calculate: Conversion rate (new version) – Conversion rate (old version). Now they aren’t calculating total traffic differences across days. They are calculating the difference within each matched day to ensure a fair comparison. If most days show a positive difference and the improvement is large enough to rule out random variation, the new design likely increased sales.
Why Is This Powerful?
1) Monday traffic is compared to Monday traffic. 2) Weekend behavior is compared to weekend behavior. 3) Promotion days are compared fairly within themselves. Each day acts as its own control. Accordingly, this removes the effect of other factors like seasonality, ad campaigns, or random traffic spikes. Instead of asking: “Did sales go up?” ask “Did sales go up under the same conditions?” That’s matched pair analysis in action.
Business and Real-World Applications
Matched pair analysis isn’t just for academics. Businesses use it to evaluate product changes, marketing strategies, and customer behavior. Hospitals compare patient outcomes before and after implementing new protocols. Manufacturers pair defect rates between production methods. Any situation where fairness and clarity matter can benefit from matched comparisons. Here is a list of different types of studies and tests that use matched pairs analysis: 1) Education research 2) Behaviour or psychology experiments 3) Sports and performance studies 4) Environmental or field research 5) Consumer testing 6) Workplace and HR studies 7) Before-and-after studies 8) A/B testing 9) Medical treatment comparisons
Statistical Efficiency and Advantages
One major advantage of matched pair analysis is efficiency. Pairing reduces the variance in results, so meaningful insights are easier to extract from smaller datasets. This is a major advantage as research is time-consuming and expensive with larger datasets. The focus shifts from individual scores to differences within pairs. Analysts study whether those differences are large enough to matter, rather than just random fluctuations. This approach makes interpretations sharper and stronger.
Limitations and Challenges
Like all other methods, matched pair analysis is powerful but not perfect. You need to think about design when pairing. If pairs aren’t truly comparable, you can derive inaccurate and misleading results. Researchers must clearly define matching criteria and maintain consistent measurement conditions. Also, some situations simply don’t allow clean pairing. Forcing a matched structure where it doesn’t belong can introduce bias and this would nullify any advantages that matched pair analysis offers. Always balance structure with realism for a good and reliable analysis.
How to Choose Variables in Matched Pair Analysis
Choosing the right variables is one of the most important steps in a matched pair analysis. The variables you pick determine whether your comparison is fair, meaningful, and statistically valid. Here’s how to approach it:
Pick the Outcome You Really Care About
Decide what you’re measuring. It should be something that can change between conditions. Examples: test scores, conversion rates, blood pressure, reaction time, or customer satisfaction ratings.
Tip: Don’t measure multiple variables in the same analysis unless you plan to analyze them separately.
Choose Variables That Can Be Paired
Each observation in one condition must have a logical match in the other condition. This could be: 1) The same person before and after an intervention 2) Twins or siblings 3) Matched customers or days with similar characteristics If you can’t create meaningful pairs, matched pair analysis isn’t the best method for you.
Include Variables That Aren’t the Main Focus
Match on variables that affect the outcome but aren’t the main focus. Examples: 1) In a fitness study, match by age, gender, and baseline fitness. 2) In a website test, match by time of day, traffic source, or user segment. This helps make the effect of your treatment clearer and more reliable. For example, if you are studying weight loss, you should not match participants based on how much weight they lost previously, as that removes real differences caused by the study. Matching variables should be based on external factors like age or baseline fitness, not the effect you’re trying to test or measure. Otherwise, you risk miscalculating the true impact of your treatment.
Avoid Variables That Interfere
Don’t pair on variables that the treatment might change. This can bias results. Example: In a nutrition study, don’t match on weight if weight is the outcome you’re measuring.
Keep It Simple
The more variables you match on, the harder it can be to find proper pairs. Focus on the most important factors that could affect your results. Table: Examples of Good vs Bad Variables for Matched Pair Analysis
| Study Type | Outcome Variable (What You Measure) | Good Matching Variables (Control Confounders) | Bad Matching Variables (Could Bias Results) |
| Classroom Test | Test score | Student age, prior GPA, class section | Attendance if attendance is affected by intervention |
| Fitness Program | Sprint time | Age, gender, baseline fitness level | Weight if the program aims to reduce weight |
| Website A/B Test | Conversion rate | Traffic source, time of day, device type | Prior conversions if the intervention affects them |
| Medication Study | Blood pressure | Age, gender, baseline BP | Medication dosage if the study adjusts it |
| Nutrition Study | Weight loss | Age, baseline BMI, activity level | Daily calorie intake if it’s the variable being tested |
The best variables are ones that: 1) Define your outcome clearly 2) Allow logical pairing 3) Control for key differences between subjects 4) Don’t create bias When chosen carefully, variables make your matched pairs analysis powerful, fair, and trustworthy, so you can confidently interpret your results.
Data Collection and Consistency Matter
Even the best pairing fails if data collection is inconsistent. Ensure you measure under similar conditions whenever possible. Small inconsistencies can ripple through paired comparisons and distort findings. Clear protocols and careful documentation protect study integrity. Inconsistent timing, tools, or procedures can create noise that hides real effects. For example, if one student takes a test in the morning and the other in the afternoon, differences might reflect time of day rather than the treatment. Careful, consistent data collection ensures that each pair truly reflects the impact of the condition being studied.
Communicating Matched Pair Results
Difference charts, paired line graphs, or simple visual comparisons make results easier to understand. The goal is clarity. Start by explaining what the pairs represent and why this method was used, so your audience understands that each subject or unit acts as its own control. Use simple and easy-to-understand visuals like bar charts, line graphs, or scatterplots to show differences within each pair, rather than just overall averages. Highlight patterns, such as most participants improving after an intervention, and point out any exceptions. This helps readers see the story your data tells and better comprehend your data story.
Ethical and Practical Considerations
Ethical Considerations
Matched pair designs often reduce participant numbers in research, which can lower risk exposure. But ethical responsibility remains important. First of all, it is important to maintain fairness in the study. One participant may be receiving better treatment than the other. This can be quite concerning in medical and educational studies, so it is important to ensure that your subjects understand this and provide consent. Another concern is privacy. When matching participants, you may collect sensitive and personal data like their age, health history, family dynamics, etc. It’s important to ensure the data is protected and only used for research purposes. Also, ensure you aren’t manipulating the results in any way and pairing based on getting a favorable result. It’s important to maintain fairness, transparency, and consistency in pairing.
Practical Considerations
Finding good matches is difficult and takes a significant amount of time. If you are trying to match numerous variables, it becomes even more difficult to find a suitable match. Accordingly, research may slow down or your samples size may be small. It becomes harder to generalize results on a smaller sample size. Also, if just one pair drops out of the study, it leads to a missing data challenge and reduces the statistical power of the study. Therefore, it’s important to ensure that all pairs participate until the end. Timing also affects matched pair analysis. If external factors such as seasonal shifts, economic occurrences, or other external factors influence the subjects over the study, this may affect the results or the effect of the treatment.
Everyday Thinking in Pairs
The the fun part is that you already use matched comparisons in daily life. You judge productivity before and after adopting a new routine. You tweak a recipe and compare results. You evaluate habits by observing change over time. Matched pair thinking is simply structured curiosity which is comparing conditions fairly to understand what changed.
Best Practices for Matched Pair Analysis
Strong matched pair studies follow these steps and tips: 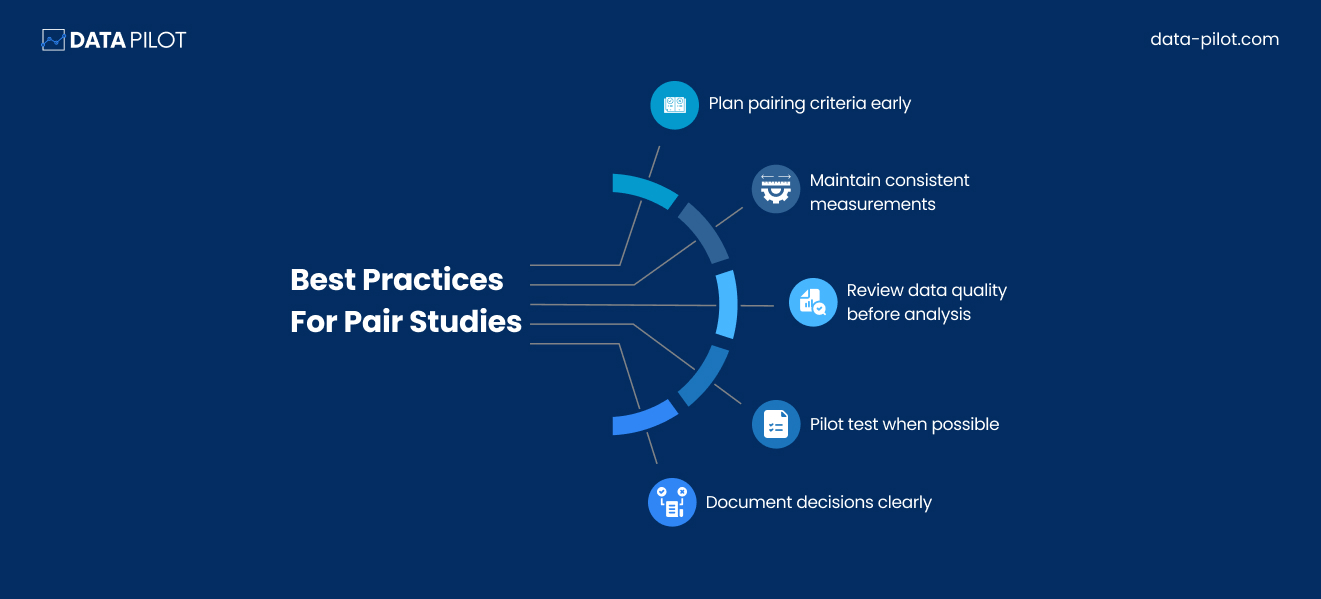 Best practices in matched pair analysis begin with planning the pairing criteria early. Be clear about which variables will be used to create meaningful and unbiased matches. Then, ensure you maintain consistent measurements across all participants. After you have gathered the data and before analysis, review data quality carefully to identify missing values or inconsistencies that could weaken the pairing process. When possible, pilot testing the matching approach can help refine criteria and anticipate challenges. Conduct the study on one pair and see how it goes. Finally, documenting all decisions clearly such as why certain variables were chosen, how pairs were formed, and how data issues were handled supports transparency and strengthens the credibility of the findings. These steps prevent avoidable bias and strengthen conclusions.
Why Matched Pair Analysis Matters
Matched pair analysis is a mindset. It teaches disciplined comparison. Instead of rushing to conclusions, you align conditions, isolate variables, and interpret differences thoughtfully. This habit builds stronger reasoning in research, business decisions, and everyday problem-solving.
Key Takeaway
Matched pair analysis is about honoring relationships within data. By comparing meaningful pairs, you strip away distractions and focus on genuine change. Whether through before-and-after studies, matched subjects, natural pairs, crossover designs, or time-based comparisons, the method is built on fairness and clarity. And that’s the key takeaway here: balanced comparison leads to clearer understanding. In a world full of information, matched pairing reminds us to slow down, compare carefully, and let meaningful differences speak for themselves. Turn it into decisions that matter. See how easy it is to design, analyze, and visualize matched pair studies like a pro and how you can organize your data to spot trends instantly. Click here to see how we do it!