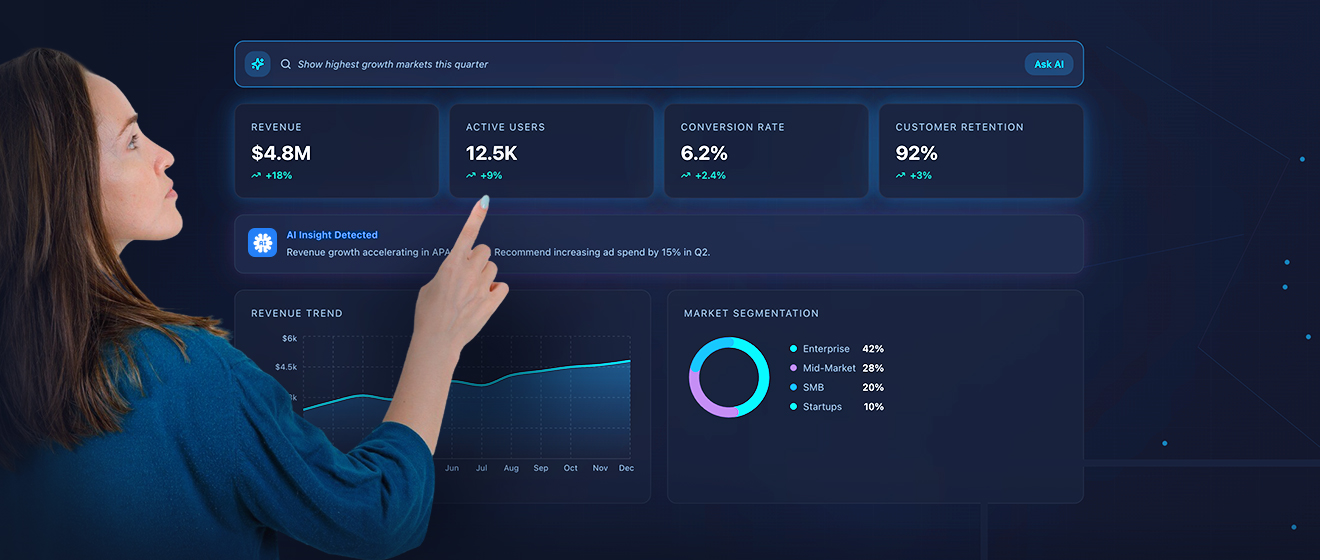
Every contemporary business runs on data. Whether you are collecting sales numbers, website visitors, monitoring customer behavior, or measuring marketing campaigns, you are collecting information. This sounds pretty straight and beneficial, but most teams are drowning in information, but completely lack insight and are frankly, starving for it.
The data? It’s dispersed in spreadsheets and different tools, and reports take days, if not weeks, to generate or build. IT teams are bottlenecks, instead of advantages, and consequently, decisions get delayed. And when decisions are delayed, opportunities disappear.
This is exactly why self-service business intelligence (BI) tools have become essential in 2026. Self-service BI tools allow regular employees, not just data analysts, to explore data, build dashboards, and uncover insights on their own.
No coding. No waiting. No complex queries. They simply turn raw data into clear answers.
If you’re a founder, manager, marketer, operations lead, or finance professional, this guide will help you understand what self-service BI really means, learn which tools are leading the market in 2026, and identify the features that matter most. It’ll also help you avoid common mistakes when choosing a tool and stay ahead of emerging BI trends.
What Is Self-Service Business Intelligence?
Business Intelligence (BI) is software that helps you analyze data and turn it into useful insights. Self-service BI means you don’t need a technical expert to do it for you. Instead of asking IT to create a report, you can:
- Click
- Drag
- Filter
- Compare
- Visualize
- Share
That independence changes everything.
Traditional BI vs. Self-Service BI
| Aspect | Traditional BI | Self-Service BI |
| Report Request | User submits request to IT | User logs in directly |
| Data Access | IT writes SQL queries and pulls data | User filters and slices data themselves |
| Speed | Days or weeks per report | Immediate, on-demand |
| Flexibility | Hard to modify; each new version requires IT | Easy to tweak, update, and explore |
| User Control | Low; dependent on IT | High; users explore and analyze independently |
| Insights | Delayed; limited by IT availability | Real-time; supports faster decision-making |
| Iteration | Slow and repetitive | Fast; experiment and discover instantly |
It takes minutes.
That speed creates better decisions, and better decisions create growth.
Why Self-Service Matters in 2026
In 2026, businesses operate faster than ever. Markets are shifting quickly and customer expectations are changing overnight. Competitors are reacting instantly and if you don’t, you will most
- Markets shift quickly.
- Customer expectations change overnight.
- Competition reacts instantly.
- AI tools generate new insights constantly.
If your data process is slow, your strategy becomes slow.
Self-service BI solves three major problems:
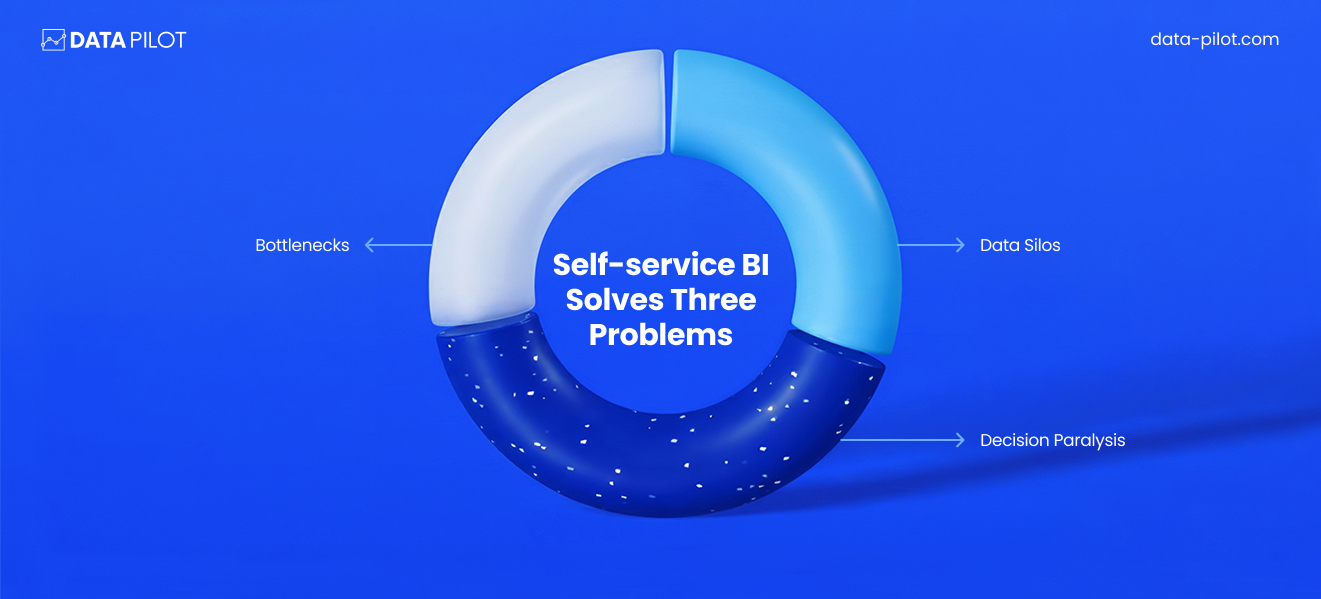
1. Bottlenecks: IT teams are overloaded. When every department depends on them for data, delays pile up. Self-service tools reduce that dependency.
2. Data Silos: Data often lives in separate systems: CRM, marketing platforms, accounting software. Modern BI tools pull everything together into one view.
3. Decision Paralysis: When leaders don’t fully trust data or can’t access it easily, they rely on guesses. Self-service BI increases visibility and confidence.
A Real-World Example
Imagine you run a mid-sized online store.
You want to know:
- Which products are selling fastest?
- Which region has the highest return rate?
- Which marketing channel drives the most profit (not just traffic)?
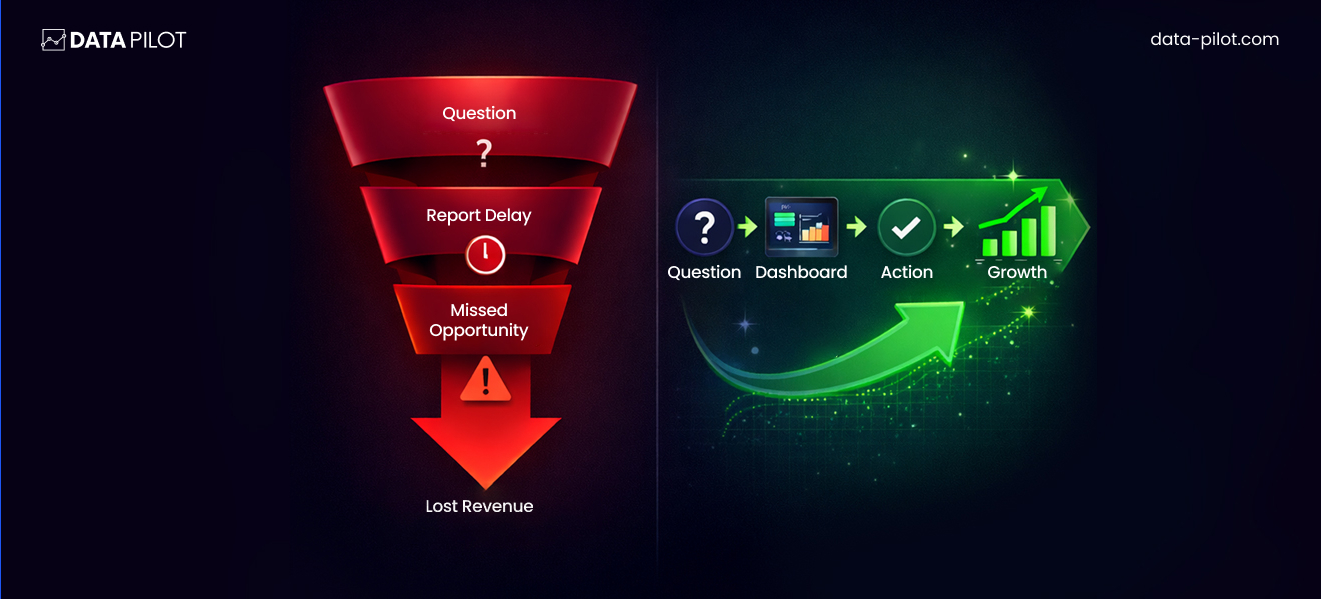
Without BI, you export spreadsheets and manually compare numbers.
With self-service BI:
You build a dashboard showing:
- Sales by product category
- Profit margin by region
- Marketing spend vs. revenue
You filter by date.
You compare this month to last month.
You identify trends instantly.
Now you can:
- Increase budget for profitable channels
- Reduce inventory for slow-moving items
- Target high-return regions with better messaging
That’s data-driven decision-making.
Who Benefits From Self-Service BI?
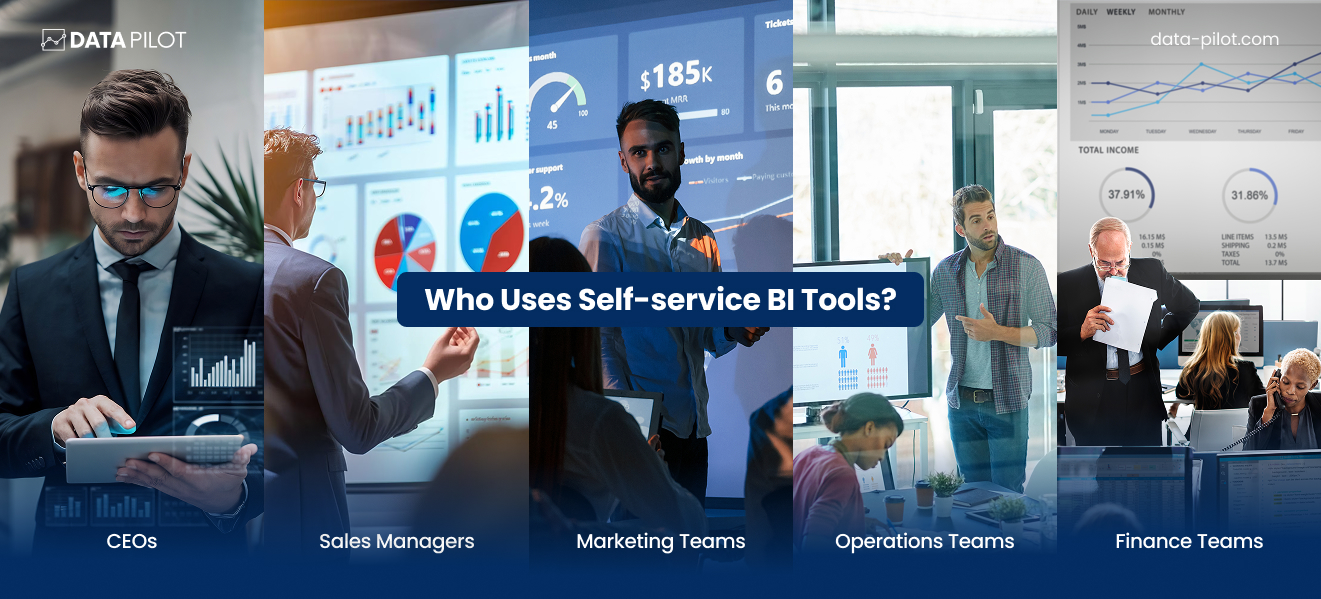
It’s not just analysts.
- CEOs use it to track company health.
- Sales managers monitor pipeline performance.
- Marketing teams measure campaign ROI.
- Operations teams reduce inefficiencies.
- Finance teams forecast revenue.
When everyone has access to insights, the entire organization becomes smarter.
The Big Shift Happening Now
Data used to be something people kept under lock and key. Today, that information is open and available to everyone in your organization. This change brings more clarity to your operations and lets your team work together faster. You also get better results because people take more responsibility for the numbers they see.
Businesses that adapt to this new way of working usually beat their competitors. These successful teams don’t necessarily have more files or larger databases than you do. Instead, they win because they actually know how to apply what they have to their daily tasks. You can gain a similar advantage by making sure your staff has the tools and permissions they need to use data effectively.
Why Self-Service BI Is Necessary in 2026
Data is the standard for doing business in 2026. It isn’t just for analysts or massive corporations. Instead, it is the primary tool you need to make smart choices. Companies that ignore their data are becoming less efficient and more vulnerable to competitors.
Speed Is a Major Advantage
A decade ago, you could take your time with decisions. Today, that isn’t an option because markets change every week. Customer tastes shift in response to new trends, and supply chains move constantly. If you wait two weeks for a report, the opportunity has already passed you by.
Self-service BI tools help you find answers immediately. This speed creates a lead over other businesses.
For example, a sales manager can fix a dropping pipeline as soon as they see the numbers change. Marketing teams can stop a bad campaign after two days instead of wasting money for a month. Fast insights lead to quick actions and better results.
The Massive Growth of Data
Every digital interaction creates a trail of information. Now, a small shop generates more data than a giant corporation did 15 years ago. However, more information doesn’t always help you make better choices. Large amounts of raw data often cause confusion.
Self-service BI tools fix this by turning messy rows of numbers into clear dashboards and visuals. Your team can see patterns instead of digging through endless spreadsheets. Leaders find trends easily, which helps them avoid unnecessary risks.
Remote Work Changes the Rules
Most teams in 2026 are spread across different locations. You might have people working from home, in a hybrid setup, or across different time zones. Because teams aren’t always in the same office, everyone needs easy access to the same information.
Cloud-based BI tools support this new way of working. They allow for live collaboration and shared dashboards with specific access levels. Everyone looks at the same source of truth. As a result, you stop wasting time on outdated files or arguing about which report is actually correct. Alignment always improves your team’s performance.
Focus on Cost Efficiency
Hiring a full team of data specialists is a significant expense. If your staff has to wait for the IT department to run every report, it slows down your entire operation. Self-service tools mean your employees don’t need a technical degree to get basic answers.
This change doesn’t make analysts obsolete; it actually helps them. They can stop building simple charts and start focusing on high-level strategy and forecasting. Meanwhile, your regular staff handles their own daily tasks. This approach lowers your costs and uses your team’s talent more effectively.
Accountability Through Open Data
When only a few people see how the business is doing, accountability often drops. However, behavior changes when everyone can see the metrics that matter. Sales reps stay on top of their goals when they track their own progress. Marketing teams watch their returns daily to stay on track.
Transparency makes people feel like they own their work. Ownership usually leads to better outcomes. Self-service BI builds this culture by making information public and easy to find.
The Connection to Revenue
Data tools directly impact your bottom line. You can use self-service BI to find your most profitable customers or figure out why people are leaving. It helps you set the right prices and predict what people will buy next.
If you know that a small group of customers brings in most of your profit, you can focus your energy on them. If you see that certain items are always returned, you can fix the problem before it hurts your budget. You can also move your marketing money to the channels that actually bring in high-margin sales. This makes your growth predictable rather than lucky.
A Better Way of Thinking
Using these tools also changes how your team thinks. Employees who have access to data feel more capable and start asking better questions. They begin to experiment because they can see the results of their work right away.
When data is part of your daily rhythm, you stop making choices based on gut feelings. Instead of guessing if a project worked, your team can show you the exact percentage of growth it created. This confidence helps you lead with more precision. Trusting the numbers reduces emotional stress and helps you stay focused on what actually works.
What Happens If You Ignore This Shift?
Staying loyal to old data habits is a risky move for any business. If you wait too long to adopt modern analytics tools, you’ll feel the friction in your daily operations.
For example, you might experience:
- Slow decision cycles that hold back your progress.
- Too much trust in reports that are already out of date.
- Revenue that slips away because you didn’t see the opportunity.
- Teams that aren’t on the same page about their goals.
- General waste and inefficiency in how you work.
Meanwhile, your competitors are using live dashboards to work faster than you. Because they see the data as it happens, they can test ideas and change their plans without waiting. They grow their business while you’re still trying to read old spreadsheets. Momentum matters in this industry; because speed builds on itself, the gap between you and the competition only gets wider over time. Use better tools now so you don’t have to play catch-up later.
Features to Look for In Self-Service BI Tools
Business intelligence software isn’t built the same way across the board. You’ll find tools that look great in a sales pitch but fall apart when your team actually tries to use them. Others are so technical that they collect dust because nobody can figure out how to generate a simple report. If you pick the wrong platform, your team won’t use it, and you’ll waste your budget. You should prioritize features that help people do their jobs instead of just buying a big brand name. These are the essentials for 2026.
Simple dashboard creation
The best self-service tools rely on a dashboard builder where you can click and move elements around. If your employees need to know how to code to see their data, the tool isn’t actually self-service. You want a system that lets you pick a dataset and drag fields into a chart to see results immediately. This ease of use is what gets people to use the software every day, which leads to better decisions across your company.
Searching with plain language
By 2026, you should expect to talk to your data like you’re talking to a person. You can type a question such as “which products sold best in Texas last month” and get a visual answer right away. This feature removes the need for long training sessions because anyone can get answers without learning complex formulas. It makes people more curious about their data, and that curiosity often leads to finding new ways to grow.
Connecting all your data sources
Your information is likely spread across different apps like your CRM, accounting software, and web store. A quality BI tool needs to pull from all these places at once. If you can’t connect your marketing spend to your actual sales revenue, you’re only seeing half the story. Integration lets you track the whole customer experience from the first click to the final purchase.
Data that stays current
Old information leads to bad choices, so you need data that updates as things happen. Many industries move too fast for a report that’s a week old. Good tools offer live data streams or at least let you schedule frequent updates throughout the day. If a sales trend changes on a Tuesday morning, you need to know by Tuesday afternoon so you can adjust your strategy.
Control over who sees what
Security matters because not every employee needs access to your sensitive financial records. You should be able to set up rules so the sales team sees their pipeline while the finance team looks at profit margins. This approach protects your private data and keeps the interface clean for your users. When people only see what they need, they don’t get overwhelmed by extra noise.
Tools for working together
Data loses its value if you can’t talk about it with your team. Modern tools should let you share dashboards, leave comments on specific charts, or send alerts directly to apps like Slack. This turns your metrics into a starting point for a conversation. For example, if a manager sees a sudden dip in production, they can tag the warehouse lead directly on the chart to find out why.
Practical automated insights
Many companies talk about AI, but you need features that actually do something useful. Look for software that spots unusual patterns or warns you about a sudden change in your numbers before you even notice it. If your customer cancellations spike, the tool should send you a notification automatically. This saves you from hunting through spreadsheets to find problems that need your attention.
Room to grow
The software you buy today should still work for you in three years. You need to check if the tool can handle more data as your business expands without the price becoming impossible to pay. A cheap option that breaks when you add ten more employees will end up costing you more in the long run. Focus on finding a platform that stays flexible as your needs change.
Access on the move
You probably spend a lot of your time away from your desk in meetings or traveling. Because of this, your BI tool must work well on a phone or tablet. You should be able to check your main KPIs and get important notifications wherever you are. High-level decisions shouldn’t have to wait until you’re back in front of a computer.
A fast setup process
Even the most advanced tool is useless if it takes a year to set up. You want a platform that provides templates and clear instructions so you can start seeing value within weeks. If the implementation is too difficult, your team will lose interest before the software is even ready. Choose something that gets you up and running quickly so you can start seeing a return on your investment.
Also Read: The Top Business Intelligence Tools for 2026
What Separates Good Tools from Great Ones?
You can easily spot the difference between a tool that helps and one that gets in the way. While basic software gives you raw data, a truly useful tool provides a clear path forward.
Consider these differences when you look at your setup:
- A standard tool lists numbers on a screen, but a better one shows you exactly what choices to make.
- Most software requires you to sit through long training sessions, yet the best options feel natural the moment you open them.
- Basic programs just display a series of charts, whereas high-quality tools actually help you drive results.
When you evaluate your options, you should think about whether a specific purchase makes your team more capable or simply gives them more tasks to manage. That distinction tells you everything you need to know about its value. Look for systems that reduce your mental load so you can focus on the work that actually matters.
Common Mistakes Decision-Makers Make
Let’s prevent expensive errors.
Mistake #1: Choosing based on brand reputation alone.
Big names are not always best for your specific needs.
Mistake #2: Ignoring user experience.
If it is hard to use, people will avoid it.
Mistake #3: Underestimating integration complexity.
Always confirm compatibility with your current systems.
Mistake #4: Overpaying for features you will never use.
Focus on essentials first.
Before you choose a tool, see where your data maturity stands with our diagnostic suite.
![]()
Assess, Diagnose, & Transform Your Data & AI Maturity.
Top Tools to Consider
1. Microsoft Power BI
Best For: Small to mid-sized businesses already using Microsoft tools.
Why It’s Popular: Power BI combines affordability with strong analytics capabilities. It integrates easily with Excel, Azure, and Microsoft 365.
Strengths:
- Strong data modeling capabilities
- Affordable pricing
- Excellent integration with Microsoft ecosystem
- Large community and support resources
Trade-Offs:
- Can become complex for non-technical users
- Advanced features require learning
Real-World Use Case:
A finance team pulls data from accounting software and Excel files into Power BI. They build automated dashboards showing revenue, expenses, and forecasts — updated daily.
Why it works: It balances accessibility and depth.
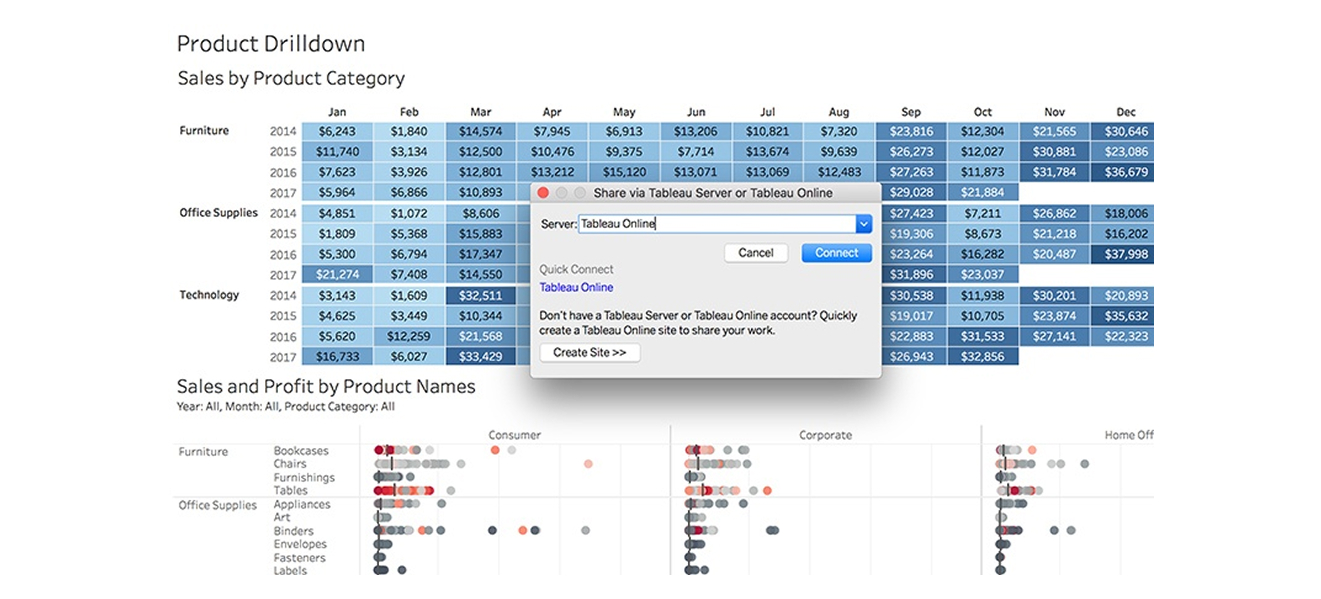
2. Tableau
Best For: Data-heavy organizations that prioritize visual storytelling.
Why It’s Popular: Tableau is known for powerful, interactive visualizations.
Strengths:
- Industry-leading data visualization
- Intuitive drag-and-drop interface
- Strong analytics flexibility
Trade-Offs:
- Higher cost compared to some competitors
- Advanced calculations require training
Real-World Use Case:
A retail chain uses Tableau to analyze regional sales performance and identify underperforming stores quickly.
Why it works: It makes complex data visually understandable.
3. Looker
Best For: Companies using Google Cloud infrastructure.
Why It’s Popular: Looker integrates deeply with Google’s data ecosystem and emphasizes centralized data modeling.
Strengths:
- Strong governance features
- Powerful data modeling
- Seamless integration with Google BigQuery
Trade-Offs:
- Requires more technical setup initially
- Pricing can be enterprise-focused
Real-World Use Case:
An e-commerce brand uses Looker to unify marketing, sales, and operations data into a single reporting system.
Why it works: It creates one source of truth across departments.
4. Qlik Sense
Best For: Organizations needing strong associative data analysis.
Why It’s Popular: Qlik’s associative engine allows users to explore relationships across data freely.
Strengths:
- Powerful data discovery
- Strong self-service analytics
- AI-assisted insights
Trade-Offs:
- Slightly steeper learning curve
- UI can feel less modern compared to competitors
Real-World Use Case:
A manufacturing company identifies supply chain inefficiencies by analyzing supplier data, shipment timelines, and cost patterns.
Why it works: It uncovers hidden relationships in data.
5. Sisense
Best For: Companies embedding analytics into their own products.
Why It’s Popular: Sisense is known for embedded analytics and customizable dashboards.
Strengths:
- Strong embedded analytics
- Scalable infrastructure
- Customizable interface
Trade-Offs:
- Higher cost for smaller teams
- Requires planning for implementation
Real-World Use Case:
A SaaS company embeds dashboards directly into its product, allowing customers to track their own performance metrics.
Why it works: It turns analytics into a product feature.
6. Zoho Analytics
Best For: Small businesses and budget-conscious teams.
Why It’s Popular: Zoho Analytics is affordable and easy to implement.
Strengths:
- Lower price point
- User-friendly interface
- Good integration with Zoho ecosystem
Trade-Offs:
- Limited advanced analytics compared to enterprise tools
- Fewer customization options
Real-World Use Case:
A growing online store tracks marketing campaigns, sales data, and customer behavior in one simple dashboard.
Why it works: It delivers value without high complexity.
7. Domo
Best For: Executives who want high-level, real-time visibility.
Why It’s Popular: Domo emphasizes real-time dashboards and executive reporting.
Strengths:
- Strong mobile functionality
- Real-time updates
- Clean dashboard experience
Trade-Offs:
- Premium pricing
- May be more than smaller teams need
Real-World Use Case:
A CEO tracks daily revenue, customer acquisition, and operational KPIs from a mobile device.
Why it works: It keeps leadership connected to performance.
How to Compare These Tools
Instead of asking, “Which tool is best?”
Ask:
- What systems do we already use?
- How technical is our team?
- Do we need embedded analytics?
- Is visualization or governance more important?
- What is our budget?
Your answers narrow the field quickly.
How to Choose the Right Self-Service BI Tool for Your Business
This is where most companies go wrong.
They see a demo.
They like the visuals.
They hear the word “AI”.
They sign the contract.
Six months later, adoption is low. The dashboards look impressive, but no one uses them daily.
Choosing a BI tool is not about picking the most powerful option. It’s about picking the most usable, scalable, and aligned tool for your specific business.
Here’s how to do that step by step.
Step 1: Define Your Primary Goal
Before you look at any vendor, answer this:
Why do we need BI right now?
Be specific.
- Are you trying to reduce reporting time?
- Improve marketing ROI?
- Gain better sales visibility?
- Forecast revenue more accurately?
- Align teams around KPIs?
If your goal is unclear, your tool selection will be unclear.
BI should solve a defined problem.
Not just look impressive.
Step 2: Audit Your Current Data Environment
Look at where your data lives today.
Make a simple list:
- CRM system
- Accounting software
- Marketing tools
- E-commerce platform
- Customer support software
- Internal spreadsheets
Now ask:
Can the BI tool connect to these systems easily?
If integration requires complex development work, implementation will slow down.
The easier the integration, the faster you see value.
Step 3: Assess Your Team’s Skill Level
Be honest here.
Do you have:
- In-house data analysts?
- Technical team members comfortable with modeling?
- Or mostly non-technical business users?
If your team is mostly non-technical, prioritize:
- Drag-and-drop simplicity
- Natural language queries
- Pre-built templates
If you have analysts, you can consider tools with deeper modeling flexibility.
Match the tool to your people – not the other way around.
Step 4: Evaluate Ease of Adoption
The best BI tool is the one your team actually uses.
During demos, pay attention to:
- How intuitive the interface feels
- How quickly dashboards can be created
- Whether filters and charts feel natural
- How steep the learning curve appears
Ask vendors:
How long does onboarding typically take?
If the answer is “several months,” consider the impact on momentum.
Quick wins build confidence.
Confidence drives adoption.
Step 5: Prioritize Scalability
Your business today is not your business tomorrow.
Think ahead.
Ask:
- Can this tool handle larger datasets?
- Will pricing increase dramatically as users grow?
- Does it support enterprise-level governance if needed?
- Can it expand across departments?
Choosing a tool that fits only your current size may limit you later.
Growth should feel supported, not restricted.
Step 6: Analyze Total Cost (Not Just Subscription Price)
The subscription cost is only part of the picture.
Also consider:
- Implementation time
- Training requirements
- Integration complexity
- Maintenance needs
- Add-on fees
A cheap tool that requires heavy customization becomes expensive.
A higher-priced tool that reduces manual work may save money long term.
Focus on total value, not just price.
Step 7: Test Real Scenarios Before Buying
Never rely on generic demos.
Instead, provide vendors with:
- Sample data
- Real KPIs
- Actual reporting needs
Ask them to show how your data would look in their platform.
This reveals:
- Performance speed
- Dashboard clarity
- Data modeling capability
- Practical usability
Seeing your own numbers inside the system changes everything.
Step 8: Ask the Right Vendor Questions
Here are smart questions many buyers forget:
- How does your platform handle data governance?
- What happens if we exceed data storage limits?
- How frequently does data refresh?
- How do you support security and compliance?
- What customer support options are available?
The answers tell you how mature the platform truly is.
Simple Evaluation Checklist
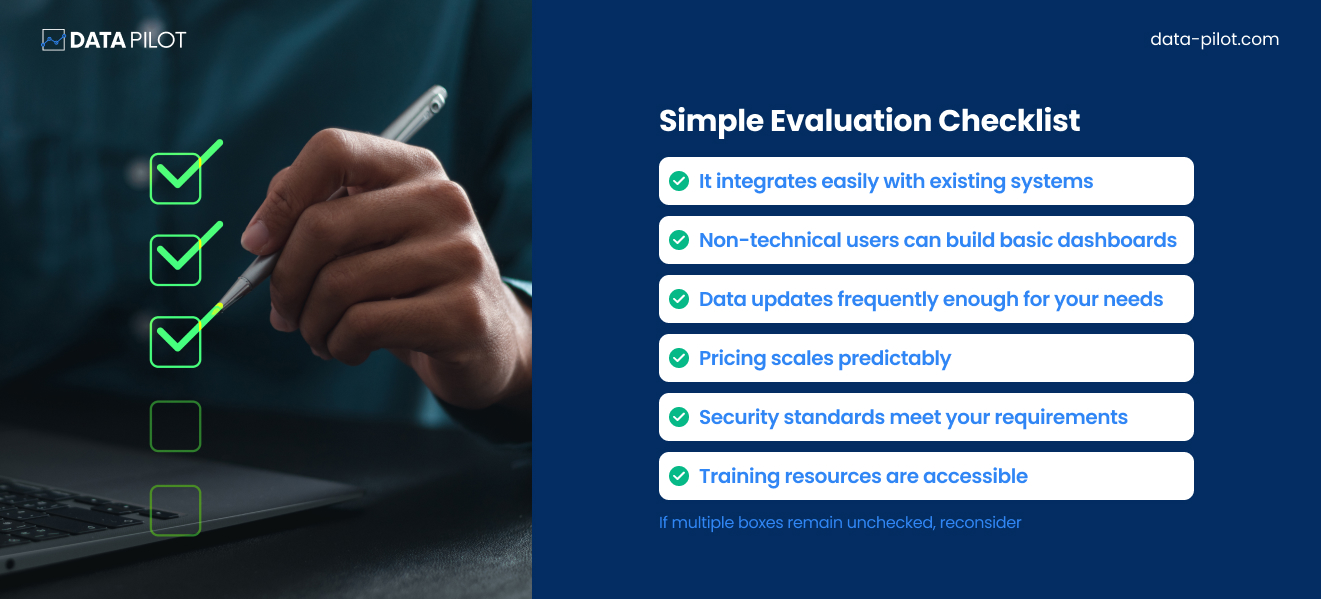
If multiple boxes remain unchecked, reconsider.
Implementation Mindset
Once you choose a tool, implementation strategy matters.
Do NOT:
- Roll it out to everyone at once
- Overcomplicate dashboards
- Overload teams with metrics
Instead:
Start small.
- Choose 3–5 critical KPIs.
- Build one strong dashboard.
- Train one department.
- Prove value.
- Then expand.
Momentum compounds when people see real results.
How to Successfully Implement Self-Service BI in 2026
If you want self-service BI to actually transform your business, you need a clear rollout strategy.
Here’s how to do it right.
Step 1: Start With One High-Impact Use Case
Do not try to fix everything at once.
Instead, ask:
What is the one area where better visibility would immediately improve performance?
Examples:
- Marketing campaign ROI
- Sales pipeline tracking
- Inventory turnover
- Customer churn
Pick one.
- Build one dashboard.
- Prove value quickly.
- When people see results, adoption grows naturally.
- Momentum is more powerful than instruction.
Step 2: Define 3–5 Core KPIs
More metrics do not equal more clarity.
In fact, too many metrics create confusion.
Choose 3–5 key performance indicators that matter most.
For example:
Marketing:
- Cost per acquisition
- Conversion rate
- Revenue per campaign
Sales:
- Pipeline value
- Close rate
- Average deal size
Operations:
- Order fulfillment time
- Return rate
- Inventory turnover
Clarity drives focus. Focus drives action.
Step 3: Keep Dashboards Simple
This is critical.
Avoid:
- Overcrowded visuals
- Too many charts
- Complex filters
- Technical jargon
A good dashboard answers one main question clearly.
If someone cannot understand it in 30 seconds, simplify it.
Step 4: Train for Confidence
Training should not feel overwhelming.
Instead of teaching every feature, focus on:
- How to navigate dashboards
- How to filter data
- How to interpret insights
- How to ask better questions
When people feel confident, they explore.
When they explore, they learn.
When they learn, they rely on the tool.
Confidence drives usage more than complexity.
Step 5: Create Data Champions
Choose a few early adopters in each department.
These are your “data champions.”
They:
- Use the dashboards regularly
- Encourage others
- Share wins
- Provide feedback
Peer influence accelerates adoption.
When teams see colleagues using BI effectively, resistance decreases.
Step 6: Integrate BI Into Daily Workflow
BI should not feel like an extra task.
It should become part of existing routines.
For example:
- Review dashboards in weekly team meetings.
- Use BI metrics during performance reviews.
- Reference dashboards in strategy discussions.
- Set alerts for important changes.
When dashboards become part of conversation, they become part of culture.
Culture sustains adoption.
Step 7: Use Alerts and Automation
Modern BI tools offer:
- Automated email summaries
- Threshold alerts
- Anomaly detection notifications
Use these features.
Instead of asking people to check dashboards constantly, let insights come to them.
For example:
- Alert when churn increases by 5%.
- Notify when revenue drops below target.
- Highlight sudden cost spikes.
Automation keeps engagement high.
Step 8: Avoid These Common Implementation Mistakes
Let’s prevent unnecessary frustration.
Mistake #1: Overengineering dashboards.
Start simple.
Mistake #2: Ignoring data quality.
If the data is wrong, trust disappears fast.
Mistake #3: Skipping change management.
Explain why BI matters. People support what they understand.
Mistake #4: Rolling out without leadership buy-in.
If executives don’t use dashboards, no one else will.
Leadership behavior sets the tone.
Step 9: Measure BI Adoption Itself
Track:
- Number of active users
- Frequency of dashboard access
- Report sharing activity
- Feedback and improvement requests
If usage is low, investigate why.
- Is it complexity?
- Is it irrelevance?
- Is it training gaps?
Continuous improvement matters.
Building a Data-Driven Culture
Self-service BI is not just software.
It is a mindset shift.
A data-driven culture:
- Asks “What does the data say?”
- Tests assumptions before acting
- Reviews performance regularly
- Adjusts quickly based on insight
This culture increases agility and agility creates resilience. Resilience strengthens long-term growth.
What Success Looks Like
You know BI is working when:
- Teams rely on dashboards daily
- Decisions reference data consistently
- Reporting time decreases significantly
- Cross-department alignment improves
- Performance improves measurably
At that point, BI stops feeling like a tool.
It becomes infrastructure.
And infrastructure supports scale.
The Future of Self-Service BI and the New Role of Data Strategy
Self-service BI isn’t a trend.
It’s a fundamental shift in how organizations think about data ownership, speed, and decision-making.
And the companies that win in the next five years won’t just “implement BI.”
They’ll redesign how data flows through their organization.
1. From Dashboards to Decision Systems
For years, platforms like Power BI, Tableau, and Looker have helped teams visualize data.
But visualization isn’t the end game anymore.
The future of self-service BI is:
- Embedded analytics inside workflows
- Predictive layers on top of reporting
- Natural language queries powered by AI
- Automated alerts that trigger action
We’re moving from static dashboards to living decision systems.
The question shifts from:
“Can we see the data?”
To:
“Can we act on it instantly?”
2. AI + Self-Service = Amplified Chaos
AI is pouring gasoline on the self-service fire.
Now anyone can:
- Auto-generate dashboards
- Create insights from prompts
- Build reports without technical skill
That sounds empowering.
But without strong governance?
It becomes faster misinformation.
As AI capabilities expand within BI tools, organizations will need:
- Strong semantic layers
- Unified data definitions
- Controlled data access frameworks
- Clear ownership structures
Self-service without governance creates chaos.
AI-powered self-service without governance creates exponential chaos.
The future belongs to organizations that balance autonomy with control.
3. The Rise of the Data Translator
One of the biggest changes ahead isn’t technological, it’s human.
The modern organization needs a new hybrid role:
- Part analyst
- Part strategist
- Part communicator
The Data Translator.
This role ensures:
- Business teams ask the right questions
- Dashboards answer strategic goals
- Insights turn into measurable action
Self-service BI doesn’t eliminate data teams.
It elevates them.
From report builders
To insight architects.
4. Data Strategy Becomes a Leadership Function
In forward-looking organizations, data is no longer an IT initiative.
It’s a boardroom conversation.
Executives are now asking:
- How fast can we detect performance dips?
- Can we forecast operational risk?
- Are we building a data-driven culture or just buying tools?
The future of BI is tied directly to competitive advantage.
And that means:
Data strategy must align with:
- Revenue growth
- Operational efficiency
- Customer retention
- Market expansion
Not just reporting metrics.
What Organizations Must Do Now
If self-service BI is your direction, the future demands that you:
- Invest in data architecture before tools
Tool selection without architecture is expensive decoration.
- Build governance frameworks early
Definitions, ownership, and access control must be clear from day one.
- Prioritize adoption, not implementation
A deployed BI platform that no one uses is a sunk cost.
- Treat BI as a change management initiative
Because that’s exactly what it is.
Where Data Pilot Fits In
Most organizations don’t struggle with choosing a BI tool.
They struggle with:
- Fragmented data sources
- Inconsistent metrics
- Low dashboard adoption
- Misaligned reporting
- Slow decision cycles
That’s where Data Pilot creates leverage.
Data Pilot focuses on:
- Data readiness
- Strategic alignment
- Governance frameworks
- Adoption roadmaps
- Long-term scalability
Because self-service BI doesn’t fail due to technology. It fails due to lack of structure.
And structure is strategic.
Final Thought: The Organizations That Win
In the coming years, we’ll see a clear divide.
On one side:
Companies with dozens of dashboards and no clarity.
On the other:
Organizations where data flows seamlessly into decisions.
The difference won’t be the tool. It will be strategy.
Ready to build a custom analytics system directly into the tools you use most? Book a consultation now.